| View previous topic :: View next topic |
| Author |
SH's SMA envelopes - Contrarion Swing Trading |
Stockhunter
White Belt

Joined: 10 Jun 2008
Posts: 193
|
Post: #1  Posted: Tue May 12, 2009 7:50 pm Post subject: SH's SMA envelopes - Contrarion Swing Trading Posted: Tue May 12, 2009 7:50 pm Post subject: SH's SMA envelopes - Contrarion Swing Trading |
 |
|
Hi Friends,
One more strategy for swings from me, and indeed one of my most favourite one's.
IMPORTANT : HIGH RISK HIGH RETURNS, TRADE IN OPTIONS ONLY.
I read about this strategy in Elder's book names 'Come into my trading room' ..again one of my cherished reads.
Though this strategy is proposed by Elder as a 'join the trend' kind of swing strategy however I use it for getting entries against the trend, make quick bucks and exit.
So basically I use this strategy to get into shorts when markets are going up and get into longs when markets are falling. Sounds crazy isnt it? 
Well crazy it sounds, but the profits are crazier. However since we are betting against the trend, its a HIGHLY risky strategy hence should be done in OPTIONS only where you know the max risk in advance!!
Ok without going into much details, my strategy requires to plot an SMA envelope around 17 SMA on EOD charts. SMA envelopes on icharts can be plotted on Charts (premium) which are free to be used by all !!
Every scrip has a different setting for envelopes, the idea is that the envelope should cover 95% of the EOD candles leaving only 5% candles outside the envelope.
And these are the 5% candles (or days) which we wait for to enter our contrarion trades.
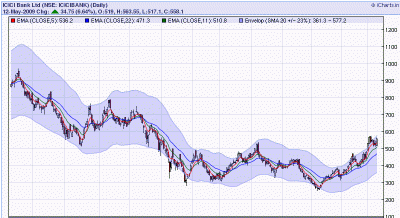
I will use ICICI Bank as an example here. For ICICI Bank the envelope size is 23% (or 0.23 setting on icharts).
Whenever markets rally and prices touch or go outside the channel walls, we short by buying PUTS. Now which put to buy?? Since I have already mentioned that its high risk strategy, we want to keep our stake small hence we will always buy deep OTM (Out of Money) puts. This will not just keep our risk small, it will also give better % returns on investment. We will try and buy that strike price which is closer to where EOD 5 EMA is currently placed since we want price to reverse and hit 5 EMA and then 11 EMA.
What if we buy puts when markets are wildly running up and next day we have another gap up? well, you either sit with puts since the risk is small.. or add more puts at much cheaper price and wait for reversal! usually within 2-3 days price reverses making your OTM puts ATM.
Now continuing with ICICI example, in the last trade, the short signal was given on 4th May when ICICI closed at 529 after a gap up. 5 EMA was at around 480-490 so we buy 490 PE. Next day ICICI gapped up again and closed at 569. at that point 5 EMA was at 530. As above you buy 530PE at this point and wait...
In next 3 days ICICI corrected and made a low of 513. At this point both your puts come in heavy profits hence you book 
My experience - If you trade this strategy 10 times, you will end up doubling your option value atleast 6 times, come out at breakeven at 2 times and probably lose 50-60% 2 times.
Rest you can check the charts.... I am posting ICICI EOD charts with SMA envelope for your reference.. please see how price reverses when it touches or falls outside the channels.
Comments are welcome !
Cheers
SH
| Description: |
|
| Filesize: |
31.01 KB |
| Viewed: |
850 Time(s) |

|
|
|
| Back to top |
|
 |
|
|
 |
nareshch
White Belt

Joined: 08 Apr 2009
Posts: 5
|
Post: #2  Posted: Tue May 12, 2009 8:08 pm Post subject: Posted: Tue May 12, 2009 8:08 pm Post subject: |
 |
|
Hi SH,
How to derive the envelop width for differant stocks and nifty ? Is that we have to try differant envelop settings and see that majority of candles liesbetween envelops?
Naresh
|
|
| Back to top |
|
 |
Stockhunter
White Belt

Joined: 10 Jun 2008
Posts: 193
|
Post: #3  Posted: Tue May 12, 2009 8:14 pm Post subject: Posted: Tue May 12, 2009 8:14 pm Post subject: |
 |
|
| nareshch wrote: | Hi SH,
How to derive the envelop width for differant stocks and nifty ? Is that we have to try differant envelop settings and see that majority of candles liesbetween envelops?
Naresh |
Yes Naresh, play with your setting and find the best suited % width.. personally I use 10% for Nifty and 20-25% for stocks.. but each stock will have slight variation.
Also please note, the envelope width is not static but exapnd contracts with price movement.. obviosly at 10% width when Nifty 17 SMA is at 5000 means a 1000 point wide channel (500 points on each side) and when Nifty 17 SMA is at 3000 it will be just 600 points wide.
Also, since volatalities in stocks vary over different period, keep adjusting the % ... the trick is to trade on 5% candles only every year.
Cheers
SH
|
|
| Back to top |
|
 |
vinst
Black Belt

Joined: 09 Jan 2007
Posts: 3303
|
Post: #4  Posted: Wed May 13, 2009 9:30 am Post subject: Posted: Wed May 13, 2009 9:30 am Post subject: |
 |
|
Hi SH,
The 95% criterion to be applied to how much historic data? For EOD, shall one look for envelopes covering 95% of the prices in last 3 months or 6 months or 12 months or ...?
This is the only question remaining for me.
thanks and regards,
vin
|
|
| Back to top |
|
 |
ConMan
White Belt

Joined: 06 Aug 2008
Posts: 344
|
Post: #5  Posted: Wed May 13, 2009 9:32 am Post subject: Posted: Wed May 13, 2009 9:32 am Post subject: |
 |
|
Hi SH
Thank You for a new strategy...
I feel this particular strategy will help a swing trader or a short term investor in right entry & exit points.
Few Questions:
1. Do you suggest we use 17 SMA for all the envelopes as a standard one...
2. There are times when the prices stay above the envelope for a longer than usual time... do you suggest we wait for the prices to come into the envelope and trade or just trade as soon as we see prices outside envelope
3. Is there a way to find our intraday envelopes?
4. I know you are not a fan of bollinger bands....but can we also use them in addition to the envelopes to execute trades....are they both compatible....
Regards
Anand Rathi
|
|
| Back to top |
|
 |
Stockhunter
White Belt

Joined: 10 Jun 2008
Posts: 193
|
Post: #6  Posted: Wed May 13, 2009 11:10 am Post subject: Posted: Wed May 13, 2009 11:10 am Post subject: |
 |
|
| vinst wrote: | Hi SH,
The 95% criterion to be applied to how much historic data? For EOD, shall one look for envelopes covering 95% of the prices in last 3 months or 6 months or 12 months or ...?
This is the only question remaining for me.
thanks and regards,
vin |
Vinst - plot on atleast 12 months and see how the price behaved to ascertain whether current setting is apt or not.
Cheers
SH
|
|
| Back to top |
|
 |
Stockhunter
White Belt

Joined: 10 Jun 2008
Posts: 193
|
Post: #7  Posted: Wed May 13, 2009 11:21 am Post subject: Posted: Wed May 13, 2009 11:21 am Post subject: |
 |
|
| bullishanand wrote: | Hi SH
Thank You for a new strategy...
I feel this particular strategy will help a swing trader or a short term investor in right entry & exit points.
Few Questions:
1. Do you suggest we use 17 SMA for all the envelopes as a standard one...
2. There are times when the prices stay above the envelope for a longer than usual time... do you suggest we wait for the prices to come into the envelope and trade or just trade as soon as we see prices outside envelope
3. Is there a way to find our intraday envelopes?
4. I know you are not a fan of bollinger bands....but can we also use them in addition to the envelopes to execute trades....are they both compatible....
Regards
Anand Rathi |
Anand,
1. Answer is Yes.
2. Answer is trade when candle is outside the envelope.. the farther outside the better.
3. Yes, same concept of overing 95% candles.
4. Thanks for BB suggestion, I will try that combo out.
Cheers
SH
|
|
| Back to top |
|
 |
ConMan
White Belt

Joined: 06 Aug 2008
Posts: 344
|
Post: #8  Posted: Thu May 14, 2009 7:04 am Post subject: Posted: Thu May 14, 2009 7:04 am Post subject: |
 |
|
HI SH
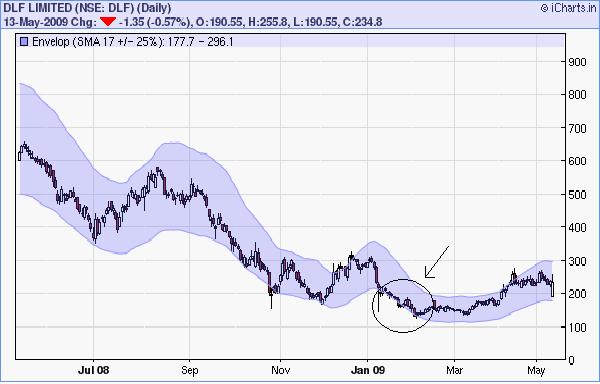
I have tried using envelope on DLF with 17,0.25 setting.
1.Kindly confirm if my setting is right.
2.Can you help me with how to deal with the area marked in circle.
3.Lets say I trade options with this strategy...are stock options liquid.?
Thanks
Anand Rathi
| Description: |
|
| Filesize: |
37.17 KB |
| Viewed: |
3656 Time(s) |

|
|
|
| Back to top |
|
 |
Stockhunter
White Belt

Joined: 10 Jun 2008
Posts: 193
|
Post: #9  Posted: Thu May 14, 2009 8:38 am Post subject: Posted: Thu May 14, 2009 8:38 am Post subject: |
 |
|
Hi Anand,
Envelope looks a bit wide, I cant see 5% candles outside the envelope. Try reducing the width.
The area marked in circle is where you would lose 50-60% or even 100% of your option premium if you buy calls since the markets keep crashing even when they are out of channels.
As I said in my orginal posts, 20% of the times this trade would fail... however the rest 80% trades would be enough to give you overall handsome returns.
Cheers
SH
|
|
| Back to top |
|
 |
Stockhunter
White Belt

Joined: 10 Jun 2008
Posts: 193
|
Post: #10  Posted: Wed May 27, 2009 12:28 pm Post subject: Posted: Wed May 27, 2009 12:28 pm Post subject: |
 |
|
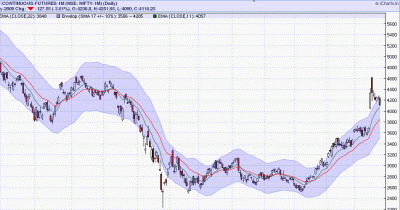
Ok folks.. time for an update on this one... not sure how many people are tracking this but Nifty went way outside the channel after the monsterous gaps ups and circuits... On Tuesday when NIfty opened at 4600 buying 4400 or 4300 puts was not a bad idea at all as per this contrarion trading set up....
Please see how Nifty has been falling since then and currenlty trading at 4195 odd levels today ....
Similarly check out ICICI Bank charts .. from 800 to 700 now !
Cheers
SH
| Description: |
|
| Filesize: |
36.02 KB |
| Viewed: |
643 Time(s) |

|
|
|
| Back to top |
|
 |
ConMan
White Belt

Joined: 06 Aug 2008
Posts: 344
|
Post: #11  Posted: Wed May 27, 2009 8:25 pm Post subject: Posted: Wed May 27, 2009 8:25 pm Post subject: |
 |
|
Dear SH
I follow this actively...but instead of buying puts I went short on the market. I have few doubts...when the upper limit of the envelope is breached and when the expiry is near...which month option should one buy... also tell me if its a good idea to write the opposite option than to but the suggested option...in the sense should I buy puts or write calls.
How do we arrive on option strike price...
Pl help
|
|
| Back to top |
|
 |
Stockhunter
White Belt

Joined: 10 Jun 2008
Posts: 193
|
Post: #12  Posted: Wed May 27, 2009 8:31 pm Post subject: Posted: Wed May 27, 2009 8:31 pm Post subject: |
 |
|
| bullishanand wrote: | Dear SH
I follow this actively...but instead of buying puts I went short on the market. I have few doubts...when the upper limit of the envelope is breached and when the expiry is near...which month option should one buy... also tell me if its a good idea to write the opposite option than to but the suggested option...in the sense should I buy puts or write calls.
How do we arrive on option strike price...
Pl help |
Anand - please refer to my original post, I suggest we buy OTM options. Shorting is slightly dangerous since if markets keep running away you will need a lot of patience (and money) to either short at every rise to maintain profits.
Selling options would put you in the same position as if tyrading in futures with a handicap that in writing options your profit becomes very limited.. writing hence is not worth it ..! either buy OTM option if you wanna play it safe or take positions in futures.. writing options no way !
If the expiry is near obviously we go for next month's OTM options.
Cheers
SH
|
|
| Back to top |
|
 |
ConMan
White Belt

Joined: 06 Aug 2008
Posts: 344
|
Post: #13  Posted: Wed May 27, 2009 11:32 pm Post subject: Posted: Wed May 27, 2009 11:32 pm Post subject: |
 |
|
Thanks SH
Can you also confirm on the exit of a particular contract...
|
|
| Back to top |
|
 |
Stockhunter
White Belt

Joined: 10 Jun 2008
Posts: 193
|
Post: #14  Posted: Thu May 28, 2009 4:48 pm Post subject: Posted: Thu May 28, 2009 4:48 pm Post subject: |
 |
|
| bullishanand wrote: | Thanks SH
Can you also confirm on the exit of a particular contract... |
Anand - exit when you get double of what you paid initially 
Cheers
SH
|
|
| Back to top |
|
 |
ConMan
White Belt

Joined: 06 Aug 2008
Posts: 344
|
Post: #15  Posted: Sun May 31, 2009 9:52 am Post subject: Posted: Sun May 31, 2009 9:52 am Post subject: |
 |
|
Hi SH
DLF trading out of its envelope...I tried buying 5 EMA which is 370PE but the issue is only 8 contracts were traded today...should I buy 380PE where more than 50 contracts are traded..
|
|
| Back to top |
|
 |
|

