| View previous topic :: View next topic |
| Author |
Six Sigma Trading System |
parasharsoman
White Belt

Joined: 02 Apr 2010
Posts: 8
|
Post: #1  Posted: Mon Aug 23, 2010 10:08 pm Post subject: Six Sigma Trading System Posted: Mon Aug 23, 2010 10:08 pm Post subject: Six Sigma Trading System |
 |
|
Hi friends,
Here I am posting my trading strategy which I call six sigma trading system. I am also a student of market like you all, so any suggestions, criticisms are welcome.
Coming to the system why I call it six sigma is because six sigma is a management concept which denotes zero error efficiency. I will never claim that my system is zero error system, but definately one of the accurate systems available.
In my trading system I use different technical parameters to analyse the Market.
1.Bollonger Bands
2.Simple Moving Averages
3.Price action and candlesticks.
4.ADX
5.RSI
6.Volume
Six Parameters hence Six Sigma.
Now first Bollinger Bands:-
I use Bollinger Bands to guage the volatility in the market as well as to identify important support and resistance.
Simple Moving Averages:-
I use Simple Moving averages to identify the trend.
I use 5 days, 20 days and 50days SMA to study very short term, Short term, and medium term trend.
Price action and candlesticks:-
I use price action and candlestick patterns to take entry and exit.
ADX:-
One of the most important but ignored indicator.
I use this to identify what is going on in the background. Who is in real control of the market.
RSI:-
Relative Strength Index
Awell known widely used indicator.
Very useful in taking decision of entry and exits.
Volume.
A confirmative indicator.
Now instead of going deep in to theory I would like to go straight to the examples.
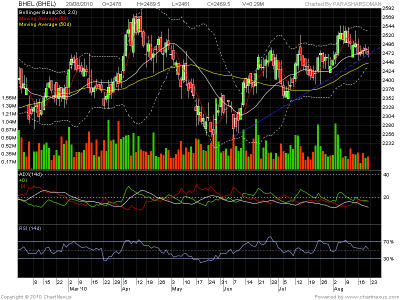
In the attachment you will find BHEL Chart along with all our parameters.
Now if you see in earlier upmove bhel has gone up to 2540 from 2380. Now it consolidating around 2450-2470. It is now right time to go long in this counter. with S/L just below 2448 and with a target of 2520-2540. Now the imp question WHY?
1. 20 SMA is above 50 SMA prices are just moving apound 20SMA.
2.RSI Just above 50 showing positive indication. Stock is still in bull territory.
3.ADX below 15 so no serious down trend this must be just a retracement.
4.Further confirmation prices are just near trendline support.
5.As the prices are coming off volume is declining.
6.Market is in uptrend.
How many reasons you need to buy a stock.
Just buy it a safe bet to play ..
Regards,
Parashar
| Description: |
|
| Filesize: |
56.11 KB |
| Viewed: |
473 Time(s) |

|
|
|
| Back to top |
|
 |
|
|  |
parasharsoman
White Belt

Joined: 02 Apr 2010
Posts: 8
|
Post: #2  Posted: Mon Aug 23, 2010 10:11 pm Post subject: Posted: Mon Aug 23, 2010 10:11 pm Post subject: |
 |
|
Now one more example to give you a deep insight.
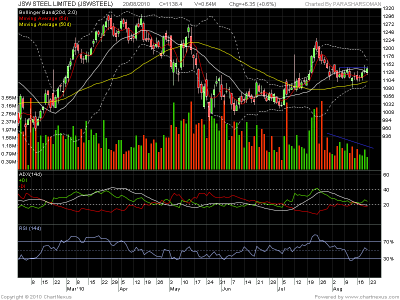
Please find attached chart of JSW steel.
Look at the Hammer formed on 12th Aug. it was a classic buy signal given by six sigma.
On 12th Aug. the prices bounced from an intra ady low of 1083.
50SMA was at 1088
Lower Bollinger Band was at 1080. Prices bounced back from a important support zone..
Now look at RSI It was in oversold zone at 25.
if you see previous chart there was one pivotal low of 1088 in the starting of May.
Your entry should have multiple confirmations.
Now what to do in this stock at current level?
If you analyse the chart you will come to know prices have rallies from 1083 to 1140. and on friday the stock closed above 20 day SMA of 1130.
But look at the slope of 20day SMA it is declining.
Now look at bollinger bands they are narrowing, which implies low volatilty. Low volatility is often followed by high volatility. Now lets check what is going on RSI front. RSI is just above 50 mark its in bull territory, and resting above 50.
Now if check ADX it is at 20 confirming the trading market.But remember many time trend takes birth when ADX is around 20 mark. Now if we analyse the +DMI and -DMI lines it seems that bulls are in control. Volume is declining is a warning sign.. Break out is expected...
In this case taking in to consideration multiple factors we should take long position only if price closes above 1150. Because 1140-1150 is a resistance zone for last 12 trading sessions. Those who are already long can keep a stop loss of 1100.
Above 1150 Go long with a stop loss of 1120 and target of 1230.
Regards,
Parashar
| Description: |
|
| Filesize: |
52.91 KB |
| Viewed: |
446 Time(s) |

|
|
|
| Back to top |
|
 |
parasharsoman
White Belt

Joined: 02 Apr 2010
Posts: 8
|
Post: #3  Posted: Mon Aug 23, 2010 11:19 pm Post subject: Posted: Mon Aug 23, 2010 11:19 pm Post subject: |
 |
|
Dear Friends,
Posting both the charts again under strategies section as mentioned by Amit.
Both the stock performed well as expected...
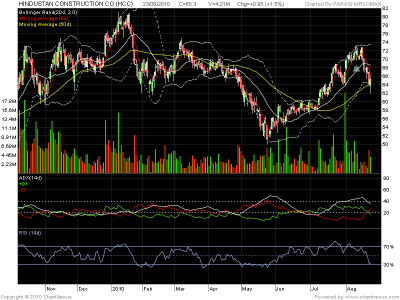
Now moving ahead we will study HCC today...
Same story like JSW steel.
After consucative 5 down days today was the first up day with closing in a upper half of the candle.
Now if you look at the chart you will come to know it has bounced back from a Pivotal support zone.
Look at Lower bollinger band it is at 63.60
50SMA is at 64.20 to days low is 62 and closing is 65.20, Hence it is clear that massive buying has emerged around that support zone.
And if you carefully analyse the previous chart, there were three lows in the beginning of Feb around 62 Mark.
And also look at RSI it is just coming out of that oversold area.
As our friend Pradeep adviced I checked HCC on weekly as well as Monthly Charts. 62 is very imp support on all time frames.
Overall a great buy.
But you should buy it if tomorrow is a up bar with higher high and closing above todays high is desirable but not necessary..
Regards,
Parashar
| Description: |
|
| Filesize: |
56.55 KB |
| Viewed: |
430 Time(s) |

|
|
|
| Back to top |
|
 |
enroute
White Belt

Joined: 01 May 2010
Posts: 64
|
Post: #4  Posted: Tue Aug 24, 2010 12:06 am Post subject: Posted: Tue Aug 24, 2010 12:06 am Post subject: |
 |
|
| hi parasharsoman,i like your strategy...keep sending more examples
|
|
| Back to top |
|
 |
|
|
You cannot post new topics in this forum
You cannot reply to topics in this forum
You cannot edit your posts in this forum
You cannot delete your posts in this forum
You cannot vote in polls in this forum
You can attach files in this forum
You can download files in this forum
|
Powered by phpBB © 2001, 2005 phpBB Group
|
|

