| View previous topic :: View next topic |
| Author |
Soy Ref Oil |
g_kab35
White Belt

Joined: 03 May 2009
Posts: 76
|
Post: #16  Posted: Thu Jun 02, 2011 10:35 am Post subject: Posted: Thu Jun 02, 2011 10:35 am Post subject: |
 |
|
1 Jun 2011.
NCDEX Jun: 661.4/661.4/653.25/653.8
OI Total all contracts: rises from 225k to 232k.
(After first week in new month, current contract loses its steam. So for this week we have to consider total contracts OI position.)
Sharp decline in prices, indicating bearish mood. Though I will not go short until prices crosses barrier of 8ema & 13ema. If prices do not crosses these lines, it will be a false breakout. If prices go ahead in downward and crosses 20 dma, then it will direct go to big bears hand. Interesting to see next move of the market.
Good Luck.
|
|
| Back to top |
|
 |
|
|
|
g_kab35
White Belt
Joined: 03 May 2009
Posts: 76
|
| Post: #17 Posted: Fri Jun 03, 2011 10:18 am Post subject: |
|
|
2 Jun 2011.
NCDEX Jun: 654.6/659.5/653.4/659.05
OI Total: steady @ 308k.
Yesterdays red candle was a false breakout. Prices rises again and hope will continue for next few sessions.
The bullish factor is, less than expected receipt and stock of the oilseeds in northern area of country. While bearish factor is earlier arrival of the monsoon. Due to unexpected lottery to farmers in cotton this season, the chances of decrease in oilseed sowing may happens. But this fundamental point will be unclear until sowing figures came out. Till then speculators will speculate as per their perception.
Good Luck.
|
|
| Back to top |
|
|
g_kab35
White Belt
Joined: 03 May 2009
Posts: 76
|
| Post: #18 Posted: Mon Jun 06, 2011 9:33 am Post subject: |
|
|
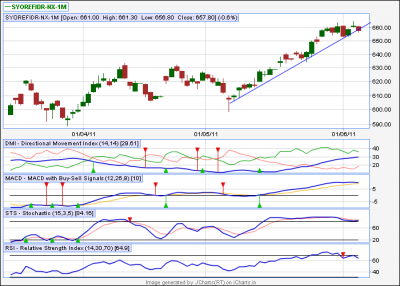
4 Jun 2011. Saturday.
NCDEX Jun: 661/661.3/656.8/657.8
OI all contracts: steady at 306k.
Pls find the attached chart. Its self explanatory. Monday's market is crucial, as it will define whether market may lose its steam or not.
Good Luck.
| Description: |
| The prices at their main support lines. If it breached, then it will be end of bull run of the month. |
|
| Filesize: |
29.75 KB |
| Viewed: |
554 Time(s) |
|
|
|
| Back to top |
|
|
g_kab35
White Belt
Joined: 03 May 2009
Posts: 76
|
| Post: #19 Posted: Wed Jun 08, 2011 8:55 am Post subject: |
|
|
7 Jun 2011.
Good Morning.
NCDEX Jul: 652/655.7/650.15/654.85
OI Total: rises from 303k to 321k.
Bearish mood in physical market, timely arrival of monsoon, direction less prices in futures & hepthy rise in OI, indicating bear ahead. Although closing value just touching 20 dma, which is its intermediate support, we will see bull bear war at this point. Further market will take clue from foreign exchanges to define its move.
This time definitely not for long.
Good luck.
|
|
| Back to top |
|
|
g_kab35
White Belt
Joined: 03 May 2009
Posts: 76
|
| Post: #20 Posted: Thu Jun 09, 2011 6:00 pm Post subject: |
|
|
9 Jun 2011.
Good Eve.
NCDEX Jul: 654.35/656.95/649.7/652.9
OI Total: fall from 341k to 311k.
As expected, 20 dma/ema provides strong support to the prices, and bull bear war in the full color. Till yet main indicator like STS & RSI are in mid way, and not reached their oversold region. So most probably the bear will be stronger for next 3/4 sessions.
Good Luck.
|
|
| Back to top |
|
|
g_kab35
White Belt
Joined: 03 May 2009
Posts: 76
|
| Post: #21 Posted: Fri Jun 10, 2011 8:36 pm Post subject: |
|
|
10 Jun 2011.
Good Eve.
NCDEX Jul: 651/652.3/642.8/645.9
Vol: 251k
OI: 305k.
Big red candle, similarly good recovery today.
Indicators elaborates for further bearishness, but its very hard to bear to took down market below 640/635 level. In past whenever vol rises to that max level, trend reversal begins. But I don't expect big green candle just tomorrow. Most natural trend reversal happens when prises settle down at top or bottom. Expecting same here.
BTW, here I got 400+ views, but just a single reply. If all of u friends find this thread a little bit helpful, then please reply. Ur reply is most appreciated thing for me.
|
|
| Back to top |
|
|
g_kab35
White Belt
Joined: 03 May 2009
Posts: 76
|
| Post: #22 Posted: Mon Jun 13, 2011 7:38 pm Post subject: |
|
|
13 Jun 2011.
Good Eve.
NCDEX Jul: 645.5/649.3/644.4/645.1
OI Total: Steady @ 309k.
Bear exhausted, but bull is tired also. Prices are settling. Hope Friday's lowest becomes bottom for current trend. Major foreign exchanges also at their oversold regions. As we see in last few sessions, big players do not favoring further downside despite of fall in edible oil commodity globally.
Reading between the lines is, we may see bull taking control before we expecting.
Good Luck.
|
|
| Back to top |
|
|
g_kab35
White Belt
Joined: 03 May 2009
Posts: 76
|
| Post: #23 Posted: Wed Jun 15, 2011 7:54 pm Post subject: |
|
|
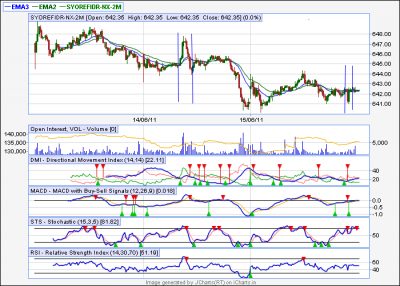
15 Jun 2011.
Good Evening.
NCDEX Jul: 641.6/644.35/640.15/642.3
OI, Total: Slowly falling, Currently & 297k.
Currently "Cut Festival" going on various exchanges. This is similar to expiry of nifty contracts, where market suffers too much volatility but no firm direction. Earlier I was predicting that market will get upward direction before the cut occurs, but prices have to wait till expiry, for confirm direction.
Will wait for next 2/3 sessions for further move.
BTW, a chart attached, which shows how volatile is the market.
| Description: |
| Check out the up & down @ Tuesdays market during 12.30 pm to 1.15 pm. No technical theory can justify this. LOL! |
|
| Filesize: |
36.24 KB |
| Viewed: |
544 Time(s) |
|
|
|
| Back to top |
|
|
vinst
Black Belt

Joined: 09 Jan 2007
Posts: 3303
|
| Post: #24 Posted: Thu Jun 16, 2011 9:14 am Post subject: |
|
|
| g_kab35 wrote: | 15 Jun 2011.
Good Evening.
NCDEX Jul: 641.6/644.35/640.15/642.3
OI, Total: Slowly falling, Currently & 297k.
Currently "Cut Festival" going on various exchanges. This is similar to expiry of nifty contracts, where market suffers too much volatility but no firm direction. Earlier I was predicting that market will get upward direction before the cut occurs, but prices have to wait till expiry, for confirm direction.
Will wait for next 2/3 sessions for further move.
BTW, a chart attached, which shows how volatile is the market. |
g_kab35,
you systematic way for 'cold blooded with open mind' analysis is great !!
Something i should learn from you !
regards
|
|
| Back to top |
|
|
g_kab35
White Belt
Joined: 03 May 2009
Posts: 76
|
| Post: #25 Posted: Thu Jun 16, 2011 7:21 pm Post subject: |
|
|
16 Jul 2011.
Good Eve.
@ vinst, Thanks buddy!
NCDEX Jul: 641/641/630.1/631.1
OI, Total: 291K.
Bloodbath! No other appropriate word for today's trade.
Support level of 635 also breached.
Hope weekly 20 ema (which is around 625) will act as strong support.
Good Luck.
|
|
| Back to top |
|
|
g_kab35
White Belt
Joined: 03 May 2009
Posts: 76
|
|
| Back to top |
|
|
g_kab35
White Belt
Joined: 03 May 2009
Posts: 76
|
| Post: #27 Posted: Fri Jun 17, 2011 7:43 pm Post subject: |
|
|
17 Jun 2011.
Good Eve.
NCDEX Jul: 630.25/638.2/626.1/637.2
OI Total: fall from 291k to 263k. (winding up short positions?)
Vol Total: Highest since December, 349k.
As stated earlier, its thumb rule that, whenever their is spike in vol, it indicates the trend change.
Yesterday market showed stiff fall, today the stiff gain. No short candle, no doji, direct rocket launch!

Doji happens here, only in the middle of the trend!!
(BTW, Edible oil e trading always confused me. If this adjacent great fall & rise occurs in thin volume commodity, its accepted. But how could one justify this in high volume game like SRO?)
Hope market will regain its steam.
Good Luck.
|
|
| Back to top |
|
|
g_kab35
White Belt
Joined: 03 May 2009
Posts: 76
|
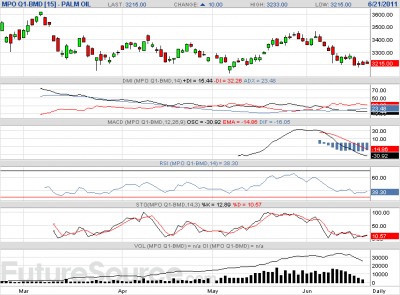
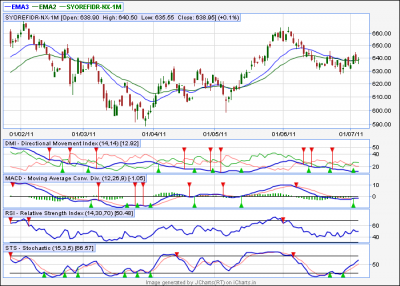
| Post: #28 Posted: Tue Jun 21, 2011 10:16 am Post subject: |
|
|
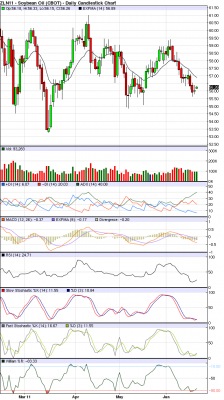
20 Jun 2011.
NCDEX Jul: 637.4/637.95/632.5/633.8
OI, Total: Steady @ 275k.
As 20th Jun is expiry of contract, expect some firm movement from tomorrow. Attached charts from worlds largest edible oil exchanges, ie Bursa Malaysia Crude Palm Oil & Chicago Board of Trades Soy Oil. If concluded from global sentiments, its not hard to find the future movement of our commodity.
Good Luck.
| Description: |
| Soy oil already fall to its intermediate support level. |
|
| Filesize: |
79.84 KB |
| Viewed: |
567 Time(s) |
|
| Description: |
| Crude Palm oil Contract at their oversold region. |
|
| Filesize: |
17.77 KB |
| Viewed: |
565 Time(s) |
|
|
|
| Back to top |
|
|
g_kab35
White Belt
Joined: 03 May 2009
Posts: 76
|
| Post: #29 Posted: Thu Jun 23, 2011 9:32 am Post subject: |
|
|
22 Jun 2011.
NCDEX Jul: 641.4/645.7/637.75/639.6
OI, Total: 270k.
Vol, Total: 273k. (Again 2 higher side.)
Previous close of the market was in between 20 ema & 34 ema. Today, during early trades, market seems to breach the strong resistance of these levels, but cant sustain it. Fall in KLCE (which was in red mood from morning) bring down the market, and settled at marginal loss.
Now clues from foreign market are more important than domestic factors.
In my opinion, if market stays at +/- current levels, it may gain marginal from next week. If foreign market falls, it may force down to 625/610 levels. (20 & 34 ema of weekly closing.)
Better to look for clues from Malaysia to initiate the trade.
Good Luck.
|
|
| Back to top |
|
|
g_kab35
White Belt
Joined: 03 May 2009
Posts: 76
|
| Post: #30 Posted: Tue Jul 05, 2011 6:46 pm Post subject: Rejoice to Rejoine! |
|
|
After a big (pending) vacation, lets back to business.
5 Jul 2011.
NCDEX Today: 638.3/640.5/635.55/639.6
Vol: 160k.
OI: 282k.
Monsoon..... We already have missed the train of timely sowing now. Not just oil seeds but overall crop position in serious danger in some part of country. Possible drought fueling the prices of each edible commodity.
Earlier estimated that, India will bring down its edible oil import by increasing domestic production. Now God knows what happens if rain will not survive the crops (& the expectations...)
Speculation & Prices both will rise as rain prolongs its journey.
| Description: |
| Chart shows enough room for further upside in prices, which is strongly supported by the drought like condition in the country. |
|
| Filesize: |
36.85 KB |
| Viewed: |
541 Time(s) |
|
|
|
| Back to top |
|
|
|