|
|
| View previous topic :: View next topic |
| Author |
Soy Ref Oil |
Arjun20
Yellow Belt

Joined: 23 Jun 2011
Posts: 945
|
Post: #31  Posted: Tue Jul 05, 2011 7:29 pm Post subject: Posted: Tue Jul 05, 2011 7:29 pm Post subject: |
 |
|
welcome back kab sir,
we were missing ur posts.
i am planning to enter in Agri commo also. Finding ur posts useful.
keep it up sir
regards
Arjun
|
|
| Back to top |
|
 |
|
| |
g_kab35
White Belt

Joined: 03 May 2009
Posts: 76
|
| Post: #32 Posted: Sun Jul 10, 2011 11:58 am Post subject: |
|
|
Good Morning.
9th Jul 2011, Sat.
NCDEX Jul: 642.15/643.8/639.35/640.5
OI: 279k.
The prices performed very rangebound & dull last week. Even at chart, the 20ema & 34 ema lines submerged into each other.
Indian market always dances with the tune of crude palm oil prices from Malaysia. During last 2/3 weeks, CPO prices touching the 8/9 months low around 3000 MYR, due to higher prediction of production, & fall in import from main customers ie. India & China. Till now, its direct impact on Indian market not seen yet. But this will bound the upper movement.
On the Indian domestic scenario, the monsoon has made progress on soyabean growing belt last week. The chances of drought reduced, even some cotton farmers may shift to soyabean due to time lag in raining. (Basically soyabean is low water low duration crop than cotton.)
Taking all these factors into account, we may see the dull movement next week. Avoid any positional Long or Short, and try more efforts for day/ swing trading.
Best of luck.
|
|
| Back to top |
|
|
g_kab35
White Belt
Joined: 03 May 2009
Posts: 76
|
| Post: #33 Posted: Wed Jul 13, 2011 7:55 pm Post subject: |
|
|
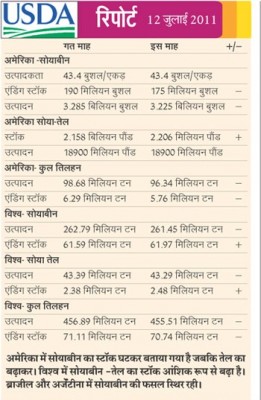
13 th Jul 2011.
Good Eve.
NCDEX Jul: 644/652.25/644/650.8
Vol Total: 262k (above average vol.)
OI Total: 306k.
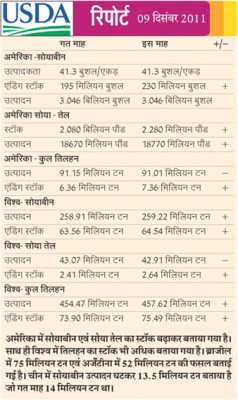
Yesterday late evening, US Dept. of Agriculture's monthly report announced. The summary of the report is that, the stock of soybean in US, is less than expected, while in world its at expected level.
Due to said report Malaysian CPO prizes went up, which directly rocketed Indian prices. Its property of Indian market to dance on each and every tap from the drum of Malaysia. Today was no exception.
The real question is, how long the market will goes up due to this USDA report effect?
I think, the steam will propel the prices next 2/3 sessions. Afterward news & speculation will be the key factors. One can go long for positional trading, by adjusting SL below 13 ema.
Good Luck.
| Description: |
|
| Filesize: |
70.92 KB |
| Viewed: |
573 Time(s) |
|
|
|
| Back to top |
|
|
g_kab35
White Belt
Joined: 03 May 2009
Posts: 76
|
| Post: #34 Posted: Thu Jul 14, 2011 7:21 pm Post subject: |
|
|
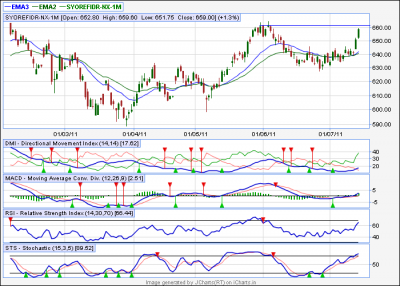
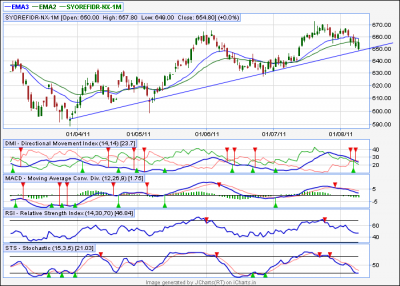
14 th Jul 2011.
Good Eve.
NCDEX Jul: 652.8/659.6/651.75/658.75
Vol Total: 244k.
OI Total: 309k.
The USDA effect boost the prices as they are at their intermediate high level around 660, where STS & RSI at around overbought region.
Be cautious here, as if this USDA zest steamed out, we will find our self at overbought region.
Most probably the prices will rise little bit further due to rise in KLCE & American market. Do not go positional short, untill the closing value crosses the 13 ema line.
Good Luck.
| Description: |
|
| Filesize: |
37.62 KB |
| Viewed: |
583 Time(s) |
|
|
|
| Back to top |
|
|
g_kab35
White Belt
Joined: 03 May 2009
Posts: 76
|
| Post: #35 Posted: Sun Jul 17, 2011 6:24 pm Post subject: |
|
|
17 Jul 2011.
NCDEX Saturday: 660/662.5/659.4/661.5
OI: 310k.
Pls refer my earlier post, which illustrates that we are in overbought region.
One can trade intraday or for small lot of positional, but do not go short with all margin engaged until we get clear signal of breach of 13 ema., as many times uptrend took support at that level.
Good luck.
|
|
| Back to top |
|
|
g_kab35
White Belt
Joined: 03 May 2009
Posts: 76
|
| Post: #36 Posted: Fri Jul 29, 2011 5:45 pm Post subject: |
|
|
Very warm greetings to everyone.
Posting the reply after long time, just feeling like meeting old friends, after long time span.
Lets do business now.
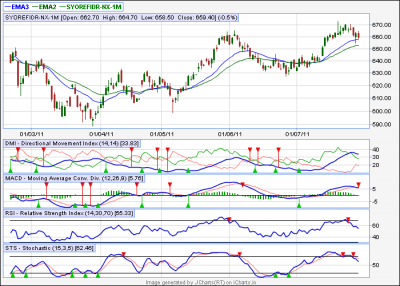
Please check the attached charts. All the major indicators showing showing bearishness ahead.
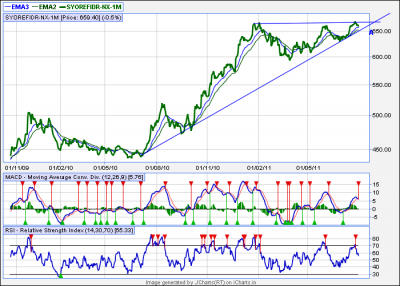
For the next chart, dear iChartians I need help. I m not to much expert in knowing flags or wedges. Daily long term chart shows interesting wedge pattern. What will happen after point "A" (at extreme right side).? Does it signs bullishness ahead?
Please post your views on my query.
Regards & best luck.
| Description: |
| Flag pattern on long term chart. |
|
| Filesize: |
54.95 KB |
| Viewed: |
555 Time(s) |
|
| Description: |
| Indicators showing bearishness ahead. |
|
| Filesize: |
37.72 KB |
| Viewed: |
572 Time(s) |
|
|
|
| Back to top |
|
|
g_kab35
White Belt
Joined: 03 May 2009
Posts: 76
|
| Post: #37 Posted: Tue Aug 09, 2011 1:08 pm Post subject: |
|
|
UPDATE: 9 Aug 2011. 12.30 pm.
Dear readers,
SRO just re bounces from its support line. Chart attached.
@ 10th Aug, USDA monthly report will publish, in which major expectation are about to decrease in soybean yield, due to weather condition in America.
While the negative factors are stiff fall in crude prices & stock market crash globally.
Regards.
| Description: |
|
| Filesize: |
41.14 KB |
| Viewed: |
616 Time(s) |
|
|
|
| Back to top |
|
|
vinst
Black Belt

Joined: 09 Jan 2007
Posts: 3303
|
| Post: #38 Posted: Tue Aug 09, 2011 1:40 pm Post subject: |
|
|
hello g_kab35,
It is very heartening to see you making the effort to post your analysis. For better learning of others, please post your trades also (need not be real time) so that we can relate to the chart features shown regularly by you.
regards,
|
|
| Back to top |
|
|
g_kab35
White Belt
Joined: 03 May 2009
Posts: 76
|
| Post: #39 Posted: Tue Aug 09, 2011 7:19 pm Post subject: |
|
|
@ vinst:
Thanks for ur concern….
Please note that, if u needs to learn the trading, there is very little use to follow others trades (& hence mistakes…)
For learning purpose, you should rely more on charts & yourself than anyone’s trade. If u trade just because of any Tom, Dick or Harry is doing it, believe me my friend, u will get nothing but heartburn in the end.
I mostly trade in position with 3 to 5 lots (+/- 1) ranging from 2/3 days to 2/3 weeks. I trade intra day occasionally, not without SL. For entry or exit, please closely read my posts, u will find it. Do profit booking where ur mind find the levels comfortable. Hope this information will help u to guess my trading. But please do not trade if u cant find any explanation for yourself on chart & just because of I am (or anyone else) do it.
Regard.

|
|
| Back to top |
|
|
g_kab35
White Belt
Joined: 03 May 2009
Posts: 76
|
| Post: #40 Posted: Fri Aug 12, 2011 6:47 am Post subject: |
|
|
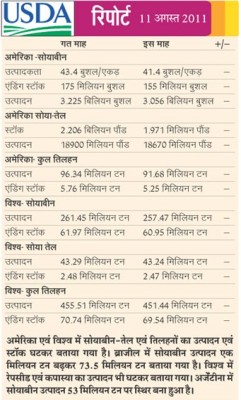
Update: 11 Aug 2011.
USDA report is out. As expected earlier, the yield of Soy crop reduced.
Hope this will fuel the bulls in coming days. While the negative factors are cheap palm oil from south east Asian countries, southern crude oil prices & better crop position in domestic field.
If the prices crosses 13 ema, one can go positional long. There is strong resisting field upward at around 670 range. If prices breaks it out successfully, then hope for bull run to 700/725 range. But for today, it seems to be little bit hard for bull to run so far.
Regards.
| Description: |
|
| Filesize: |
76.84 KB |
| Viewed: |
570 Time(s) |
|
|
|
| Back to top |
|
|
g_kab35
White Belt
Joined: 03 May 2009
Posts: 76
|
| Post: #41 Posted: Mon Aug 22, 2011 11:46 am Post subject: |
|
|
Good morning to all.
The mindset of the market is slowly shifting in favor of bulls now. Even charts showing no adjacent downtrend.
For a while, if we kept the charts aside, the physical market situations indicating the same. As stated in earlier post, the world production of soybean is expected to be reduced. In domestic ground, the new crop will not come before second or third week of Sept. Till then, the stockist will not let the prices go downward. Hope this situation will continue till mid Sept.
It doesn't means the insane bull run as happened in early 2008. The global economic situation, crude oil prices & cheap palm oil will bind the rocket. So always trade with safe SL.
Regards.
|
|
| Back to top |
|
|
g_kab35
White Belt
Joined: 03 May 2009
Posts: 76
|
| Post: #42 Posted: Mon Sep 05, 2011 12:09 pm Post subject: |
|
|
Update:
SRO just breached its main support line.
Interesting to see the market movement till 5.00 pm.
If weakness continues till end of the session today, then prices may go down further in coming days.
Regards.
| Description: |
|
| Filesize: |
27.23 KB |
| Viewed: |
577 Time(s) |
|
|
|
| Back to top |
|
|
g_kab35
White Belt
Joined: 03 May 2009
Posts: 76
|
| Post: #43 Posted: Tue Sep 06, 2011 9:37 am Post subject: Guidance from ProTrader on the chart. |
|
|
Please go through the discussion between me & ProTrader:
I wrote:
Dear sir,
first of all, thanks for providing such a beautiful platform for comparatively lesser focused agri commodity technical analysis.
I am trying to predict the movement of Soy Ref oil in my forum of the same name.
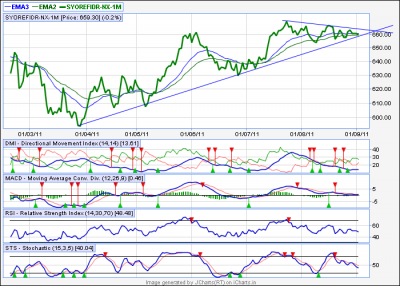
Prior to put my query, let me introduce the SRO market to u. During this period of Sept/ Oct, usually when new crop position get clearer, the market moves according to it. At present, global crop position is expected to reduce partially or at par wrt last year. Foreign Soy Oil derivative are in bullish mood. At the same time Indian crop, due to heavy rainfall, are not strong position as expected earlier. So finally, no strong factor for bearishness, rather the condition here is ideal for bull run.
Still, the prices moving in very strict range. (Please see the chart attached.) From last two months, it formed a strong support line, as well as a strong resistance line. I can just recognize that it is some kind of triangle or wedge pattern. But cant translate its indication.
I need ur help to predict the price movement after both lines meet.
If we keep the physical factors aside, and focus on just chart analysis, after that point, the prices will go up or go down? Guidance needed.
Hope u find the query interesting.
Regards.
g_kab35
And I got reply as:
Dear Sir:
As per the chart it is showing a Symmetrical Triangle, which is nothing but a sideways chart pattern between two converging trend lines in which the upper trendline is declining and the lower trend line is rising.
Right now you can see that compression is going on which reflects a balance between buyers and sellers. It also signal a significant move in offer. The breakout through either trend lines will signal the direction of the price trend.
The fundamentals based on global outlook does signifies a support for prices on the higher side. But I will be cautious due to the highly volatile world markets and rely more on technicals than fundamentals.
Hope this helps.
Regards,
ProTrader
| Description: |
|
| Filesize: |
51.08 KB |
| Viewed: |
594 Time(s) |
|
|
|
| Back to top |
|
|
g_kab35
White Belt
Joined: 03 May 2009
Posts: 76
|
| Post: #44 Posted: Sat Dec 10, 2011 9:51 am Post subject: |
|
|
Find Attachments.
| Description: |
|
| Filesize: |
36.67 KB |
| Viewed: |
544 Time(s) |
|
| Description: |
|
| Filesize: |
91.23 KB |
| Viewed: |
540 Time(s) |
|
|
|
| Back to top |
|
|
g_kab35
White Belt
Joined: 03 May 2009
Posts: 76
|
| Post: #45 Posted: Mon Dec 12, 2011 7:39 pm Post subject: |
|
|
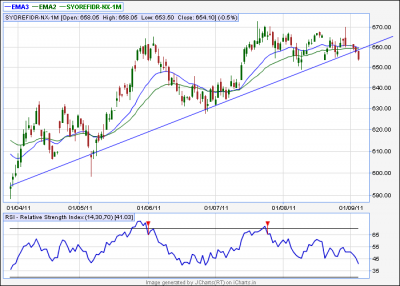
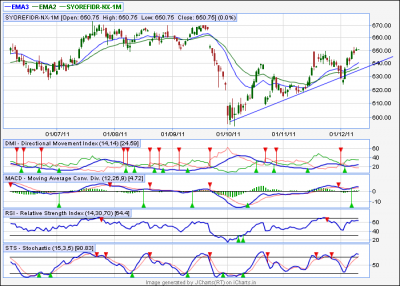
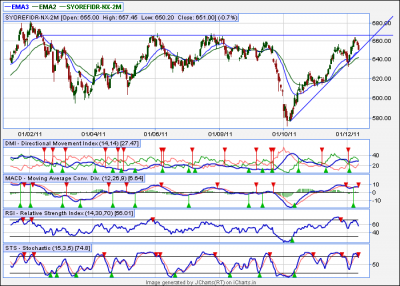
Hi to all.
Attached SRO daily chart.
From last 10/11 months, the prices got hard resistance at 670 levels.
touched approx 4/5 times.
Again, prices just resting on medium term support line, which is very crucial.
At this current levels, indicators are in overbought levels.
So I hope, if prices breaches the support line with enough volume, we will see another downfall, just like in last week of Sept'11.
Regards & Best luck.
| Description: |
|
| Filesize: |
57.38 KB |
| Viewed: |
522 Time(s) |
|
|
|
| Back to top |
|
|
|
|
You cannot post new topics in this forum
You cannot reply to topics in this forum
You cannot edit your posts in this forum
You cannot delete your posts in this forum
You cannot vote in polls in this forum
You can attach files in this forum
You can download files in this forum
|
Powered by phpBB © 2001, 2005 phpBB Group
|
|
|


