|
|
| View previous topic :: View next topic |
| Author |
Soy Ref Oil |
g_kab35
White Belt

Joined: 03 May 2009
Posts: 76
|
Post: #46  Posted: Wed Dec 14, 2011 11:48 am Post subject: Posted: Wed Dec 14, 2011 11:48 am Post subject: |
 |
|
Update: 14 Dec 2011.
The high jump of US$ from Rs. 51.88 @ 8.12.2011 to Rs. 53.57 @ 14.12.2011, made the import of edible oil more costlier, hence, the SRO prices are boiling up. This Dollar effect is most important now, so implication of formal technical analysis will show inadequate results.
Where does this $ will take the prices?
There is direct relation between edible oil price rise and devaluation of rupee. (Pls refer my very first one post.) As long as our rupee getting weak against US$, the oil prices will continue to rise. For current level of $, which is appreciated approx 3% from its weekend level, will force SRO prices to Rs. 670 levels.
What happens if US$ reaches to Rs. 55 or Rs. 60 level?
At this scenario, SRO prices will not move same to same to $ value, but will appreciate.
For Rs. 55/$, SRO will head to Rs. 690 level...
& for Rs. 60/$, SRO will goes to sky in Rs. 750 level.
At this point, I think, Govt. will interfere, as this higher levels of household will not benefited to any part of society.
Regards.
|
|
| Back to top |
|
 |
|
| |
g_kab35
White Belt
Joined: 03 May 2009
Posts: 76
|
| Post: #47 Posted: Tue Dec 20, 2011 7:34 pm Post subject: |
|
|
20 Dec. 2011.
Pls find attached chart. The SRO prices moving in strict channel and fuels by weak Rupee against US$. As predicted in earlier post, the prices went to 690 level, as $ surged to Rs. 54/55. Thus, the most important factor today is $ exchange rate. Hence, if Rs. get weaker, SRO prices will rise.
As the chart elaborate, the channel provides very strong support line (which lies somewhat near 670.)
But if breached (& if Rs. get stronger), we will see bear in the market.
Regards.
| Description: |
|
| Filesize: |
49.34 KB |
| Viewed: |
567 Time(s) |
|
|
|
| Back to top |
|
|
g_kab35
White Belt
Joined: 03 May 2009
Posts: 76
|
| Post: #48 Posted: Tue Dec 27, 2011 12:35 pm Post subject: |
|
|
27 Dec 2011. Update.
Upper circuit in the SRO. @ 26th Dec. 
The market is too incline to understand, specially when foreign market were closed for holidays & Indian market is the only mover!!!
I have reduced my positions to minimum levels, as only mean to be in market right now, is to swim in the direction of flow. No Technical or Fundamental things to support this big bubble.
BTW, All time high in SRO derivatives was 725, somewhere in Feb/ Mar 2008.
If u r trading now, pls trade with tight SL.
Regards.
|
|
| Back to top |
|
|
g_kab35
White Belt
Joined: 03 May 2009
Posts: 76
|
| Post: #49 Posted: Fri Jan 06, 2012 9:35 am Post subject: |
|
|
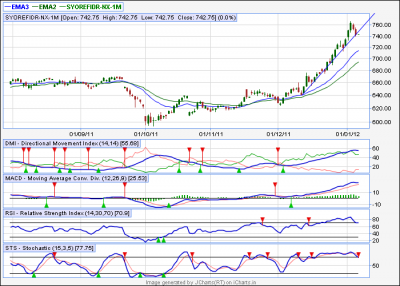
6 th jan 2012.
Good Morning.
Pls find the attached chart. The SRO prices resting on its support line, after too high bull run. This is crucial support, which if breached, will let the prices send to hand of bears.
Not only the support line, but pls find the prices (Jan series), Total Vol & Total OI.
Dt. Cl Price. Total Vol. Total OI.
2.1 750 467k 302k
3.1 764.15 562k 299k
4.1 752.75 511k 306k
5.1 742.75 545k 324k
Thus, the OI do not rises with spike in vol. Only @ 5th jan, OI rises, obviously for bear run.
Judge urself. Bull run always come with the shadow of bear.
Regards.
| Description: |
|
| Filesize: |
34.67 KB |
| Viewed: |
538 Time(s) |
|
|
|
| Back to top |
|
|
g_kab35
White Belt
Joined: 03 May 2009
Posts: 76
|
| Post: #50 Posted: Thu Jan 19, 2012 11:30 am Post subject: |
|
|
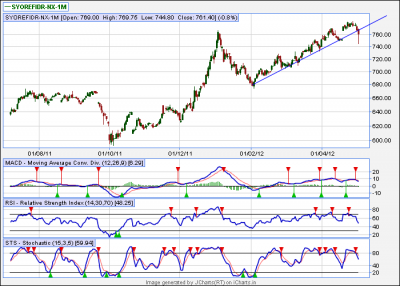
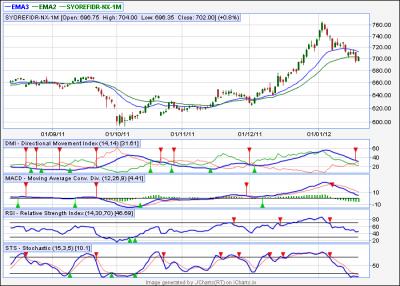
19 Jan 2012.
Good morning to all.
As expected in last post, big bear came, not by only single, but with all his family. 
Weekly chart showing more bearishness ahead. But for intermediate term, short covering could happen. Historically, when there was single day stiff fall in prices on bear run, it may brings short covering.
If these intermediate rise in prices occurs, it may not last beyond a limit, (eg, take 20 ema line.)
Fall in OI, also suggesting of end of the short contracts. Analyse urself.
Good Luck.
| Description: |
|
| Filesize: |
33.82 KB |
| Viewed: |
571 Time(s) |
|
|
|
| Back to top |
|
|
g_kab35
White Belt
Joined: 03 May 2009
Posts: 76
|
| Post: #51 Posted: Sun Feb 05, 2012 12:14 pm Post subject: |
|
|
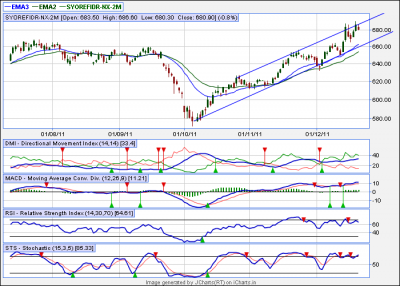
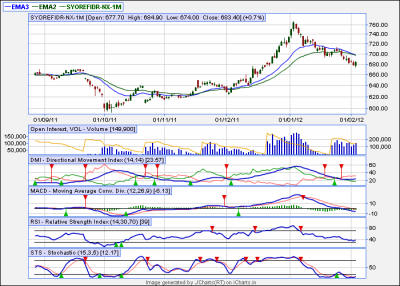
5th Feb 2012. Sunday.
Good morning to all.
As mentioned in earlier post (dated 19th Jan.), the prices rose, to the certain bit, touched 20 & 34 ema lines & falls again.
Currently daily charts showing its oversold positions. Prices rises from their friday low & support get from rising OI. (from 304k @ Thu. to 328k @ Sat.)
This is intermediate short covering trend. As per weekly charts bear has enough steam remained, so I do not feel this as beginning of long sustaining bull trend. Just 15/25 Rs appreciation is expected.
Good Luck.
| Description: |
|
| Filesize: |
45.2 KB |
| Viewed: |
576 Time(s) |
|
|
|
| Back to top |
|
|
g_kab35
White Belt
Joined: 03 May 2009
Posts: 76
|
| Post: #52 Posted: Fri Feb 10, 2012 9:31 am Post subject: |
|
|
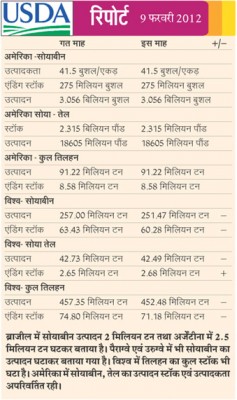
& Here is awaited USDA report, which is neutral to mild bullish.
| Description: |
|
| Filesize: |
89.42 KB |
| Viewed: |
565 Time(s) |
|
|
|
| Back to top |
|
|
g_kab35
White Belt
Joined: 03 May 2009
Posts: 76
|
| Post: #53 Posted: Fri Feb 24, 2012 7:08 pm Post subject: |
|
|
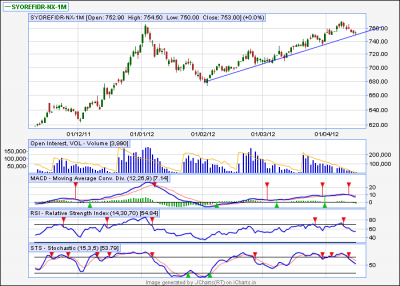
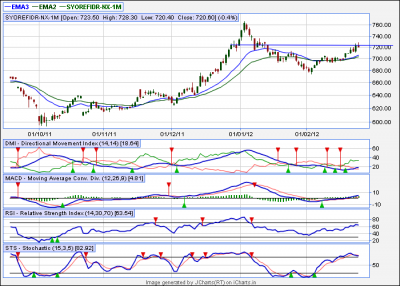
24 Feb 2012.
Good Eve.
Pls find attached chart.
The impact of USDA report, bad weather news from Brazil & Argentina, Iran issue & rising crude oil fueled the SRO prices. Thus we find 680 to 720 journey in last weeks.
Today staggered prices & fall in OI from 357k @ 23.02.2011 to 343k @ 24.02.2012, may limit the current bull run. But due to above mentioned reasons, there are very little chances of exaggerated fall in prices in coming days. Most probably, price may cooled down & will take support at 20 ema or 34 ema.
One may take positional short, sl above 730/732 levels & wait for 20/34 ema target.
Good Luck.
| Description: |
|
| Filesize: |
47.06 KB |
| Viewed: |
591 Time(s) |
|
|
|
| Back to top |
|
|
g_kab35
White Belt
Joined: 03 May 2009
Posts: 76
|
| Post: #54 Posted: Wed Apr 11, 2012 9:50 am Post subject: |
|
|
Good Morning.
Here is the USDA report for month of April'12.
Summary is bullish & most likely propel the market to 800 levels.
| Description: |
|
| Filesize: |
75.14 KB |
| Viewed: |
550 Time(s) |
|
|
|
| Back to top |
|
|
g_kab35
White Belt
Joined: 03 May 2009
Posts: 76
|
|
| Back to top |
|
|
g_kab35
White Belt
Joined: 03 May 2009
Posts: 76
|
|
| Back to top |
|
|
g_kab35
White Belt
Joined: 03 May 2009
Posts: 76
|
| Post: #57 Posted: Fri May 11, 2012 9:52 am Post subject: |
|
|
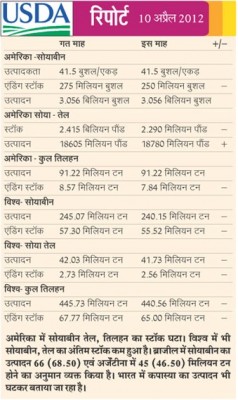
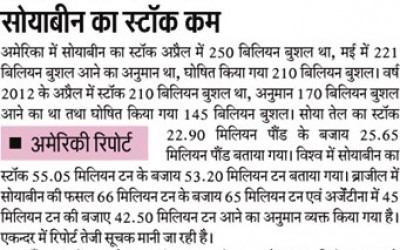
USDA oilseed report for May.
Summary is bullish. Cover short positions.
| Description: |
|
| Filesize: |
55.13 KB |
| Viewed: |
573 Time(s) |
|
|
|
| Back to top |
|
|
g_kab35
White Belt
Joined: 03 May 2009
Posts: 76
|
| Post: #58 Posted: Mon May 28, 2012 7:19 pm Post subject: |
|
|
28th May 2012. Good Eve.
Pls find attached chart. The overall summary is bullish for short to medium term. The prices may get little resistance at 740 level, but overall view is bullish now.
Apart from the technical view, the condition in the market will force the prices to rise.
Due to super sliding Rs. value, the import of edible oil becoming costlier now. Importer are facing two edged sword, as the domestic market of soy oil is bearish & rupee is falling alongside.
IMHO, there are very few number of edible oil importer who could hedge their position in both soy oil & forex. Many of them now trying to postpone the import schedule of their shipments. So, there will be shortage of edible oil in coming days & no wonder if in coming festivals, the prices rise to its recent all time high levels.
Apart from all this mess, the domestic stock of oilseeds are at their annual end session. So it cant help the supplyside beyond a extent.
By the way, hereafter, their will be a LONG break in my postings. Hope my posts helps u little. Thanks for supporting me.
Good Luck!
| Description: |
|
| Filesize: |
41.71 KB |
| Viewed: |
579 Time(s) |
![jcharts[1].png](files/thumbs/t_jcharts1_145.png)
|
|
|
| Back to top |
|
|
|
|
You cannot post new topics in this forum
You cannot reply to topics in this forum
You cannot edit your posts in this forum
You cannot delete your posts in this forum
You cannot vote in polls in this forum
You can attach files in this forum
You can download files in this forum
|
Powered by phpBB © 2001, 2005 phpBB Group
|
|
|