| View previous topic :: View next topic |
| Author |
Soy Ref Oil |
g_kab35
White Belt

Joined: 03 May 2009
Posts: 76
|
Post: #1  Posted: Tue May 17, 2011 12:45 pm Post subject: Soy Ref Oil Posted: Tue May 17, 2011 12:45 pm Post subject: Soy Ref Oil |
 |
|
Hello to everyone.
Lets directly get the point. Soy ref oil (SRO) is most traded commodity in oil & oilseed bracket. Indore's National Board of Trade (NBOT) works mainly on the same. The price movement in SRO indicates overall mentality in much broader horizon includes Crude Palm Oil (CPO), Soyabean Seed (SYB), Rape mustard seed (RM). So prediction for SYO get proper illusion for all above commodities.
Influencing factors for SRO:
1. Overall demand & supply of Soybean, Palm oil, RM oil in physical form.
2. Crude palm oil futures at Bursa Malaysia Exchange, Kuala Lumpur.
3. Soy Oil futures at CBOT, Chicago.
4. Crop, Production, Ending stock position of seed at Latin America.
5. Vessel position at port. (We import most of our edible oil thr' sea route.)
6. USD exchange rate.
7. Crude oil rate. (Possibility for bio diesel.)
Here I try to predict the SRO movement.
Last edited by g_kab35 on Fri May 20, 2011 6:39 pm; edited 1 time in total |
|
| Back to top |
|
 |
|
|
|
g_kab35
White Belt
Joined: 03 May 2009
Posts: 76
|
| Post: #2 Posted: Tue May 17, 2011 1:13 pm Post subject: Re: Soy Ref Oil |
|
|
17 May 2011.
Good Morning.
Points to be recall:
1. NCDEX Jun cl yesterday @ approx 634.5 around, after high of approx 637/638. It means, market would not sustain at higher levels & big player wants to take away their profit at same day.
2. CBOT cl in red (-23,-24,-24). It was opened in green mood. Kuala Lumpur is off today.
3. From last 2 months, prices rises to 635/640 & then again falls down. These levels now becoming strong resistance points. It will be interesting to see whether these levels get breached now or not. Further movement will decided by this break point. If prises soars above 645 with healthy volume, then we can predict bull rally for next 20/30 rs.
4. US agri report predicts increase in Soy prod & end stock. Bearish sentiment.
5. Although US agri report is bearish, Indian market still in green due to USD exchange rate. Increasing $ prices in INR, rises parity for imported oil.
6. Oilseed season is on its end. For next few months, plants will be dependant on imported Soy Degummed oil & Crude Palm oil.
7. ADX (or DMI) is flat, RSI & STS is about overbought region. No Strong lifting interpretable from technical point of view.
8. I personally feels that, this situation is not suitable for big bull run. Although continue demand from market (in physical) in edible oil, and end of Indian oilseed season will not fetch the prices to hand of bears. Expect limited bearishness now onwards for short to medium term. Baaki Bhagwan Ki Marzi.
Good Luck to All.
|
|
| Back to top |
|
|
g_kab35
White Belt
Joined: 03 May 2009
Posts: 76
|
| Post: #3 Posted: Wed May 18, 2011 6:33 pm Post subject: |
|
|
18 May 2011, Evening.
Market opened gap up, as expected, as yesterdays holiday & positive clues from KLCE & CBOT.
NCDEX Jun: 637.5/642.6/637.5/639.15
OI of May+Jun fall down from 176k to 158k. (Strange?)
Market erodes some of its early gain, and closed at marginal points up.
Prices still cant breach the levels of 640/645. Watching price movement around these pivot lines. If breached, expecting little bull run. Or again further "cooling off" expected.
Good Luck.
|
|
| Back to top |
|
|
g_kab35
White Belt
Joined: 03 May 2009
Posts: 76
|
| Post: #4 Posted: Thu May 19, 2011 7:44 pm Post subject: |
|
|
19 May 2011. Evening.
NCDEX Jun: 642/644.25/638.8/643.65
OI Jun rises from 119k to 128k.
Seems prices are ready to breach the resistance level of 640/645. If CBOT & KLCE gives positive clue, expecting bull run tomorrow.
|
|
| Back to top |
|
|
g_kab35
White Belt
Joined: 03 May 2009
Posts: 76
|
| Post: #5 Posted: Fri May 20, 2011 6:37 pm Post subject: |
|
|
20 May 2011.
Good Evening to all.
NCDEX Jun: 642.5/646.5/639.7/641.35
CBOT & KLCE were in green mood today. Still our Bull is not strong enough to break the resistance level. Around 2/2.30 pm, it look like prices going strong enough to breach the upper circuit levels. But strong selling pressure in last hour put the bear over the shoulders of bull.  
As foreign market continue to be in green, its interesting to see next move.
It this scenario, I would like to cover up my long position and to sit on cash for further direction.
Good luck to all.
|
|
| Back to top |
|
|
g_kab35
White Belt
Joined: 03 May 2009
Posts: 76
|
| Post: #6 Posted: Sun May 22, 2011 12:42 pm Post subject: |
|
|
22 May 2011. Part 1.
Good Noon to all.
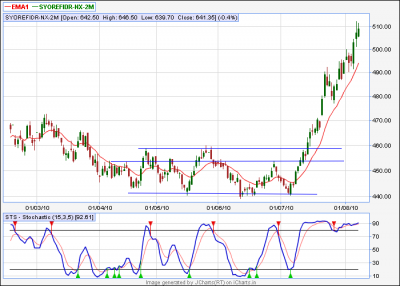
Prices going to be losing its stream. Its seems that RSO prices falls in a strong bracket. Lets look at the year old chart of price movement during April to Jul 2010.
That time prices was so strictly "sandwiched" that for 3/4 months its enable to break the resistance level.
| Description: |
| Strong resistance & support levels binds the overall prices. |
|
| Filesize: |
29.66 KB |
| Viewed: |
635 Time(s) |
|
Last edited by g_kab35 on Sun May 22, 2011 12:54 pm; edited 1 time in total |
|
| Back to top |
|
|
g_kab35
White Belt
Joined: 03 May 2009
Posts: 76
|
| Post: #7 Posted: Sun May 22, 2011 12:51 pm Post subject: |
|
|
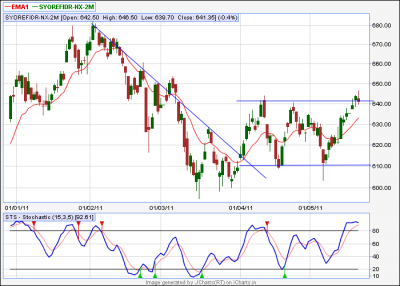
22 May 2011. Part 2.
From last 2 months, prices again behaving the same pattern as said in earlier chart. Bull cant stretch the prices higher & Bears is so weaker to pull down it all. So the result is very limited up & downs. For a trader this is an opportunity to trade in this market. But for a physical player its hard to earn his bread & butter. (That's the reason some physical traders always against the "Dabba" )
BTW, If prices falls again (Thats most likely to happen again), it will be supported by levels of 625/630. (20 ema).
Or further downside the support level is around 600, as chart elaborates.
Good Luck to all.
| Description: |
|
| Filesize: |
30.22 KB |
| Viewed: |
564 Time(s) |
|
|
|
| Back to top |
|
|
g_kab35
White Belt
Joined: 03 May 2009
Posts: 76
|
| Post: #8 Posted: Mon May 23, 2011 5:38 pm Post subject: |
|
|
23 May 2011.
Good Evening.
NCDEX Jun: 639.8/641.6/636.1/637.2
OI: steady.
As percept-ed earlier, prices drops today. For coming 2/3 session, most likely to drop again. Its interesting to see whether this downfall supported at 625/630 level OR goes straight to 600 level.
Here its better to continue in short position.
Good luck.
|
|
| Back to top |
|
|
g_kab35
White Belt
Joined: 03 May 2009
Posts: 76
|
| Post: #9 Posted: Tue May 24, 2011 7:47 pm Post subject: |
|
|
24 May 2011.
Good Eve.
NCDEX Jun: 638/642.2/634.2/641.45
OI: Jun: increased from 132k to 134k.
OI: Total: increased from 278k to 283k.
Upto midday, the bearishness was heavy on the market. But marginal increase in KLCE crude palm oil futures, brought back the bull. So the closing value came so higher.
Yet, I m short. Will wait till tomorrow for further rectification in position.
Good Luck.
|
|
| Back to top |
|
|
g_kab35
White Belt
Joined: 03 May 2009
Posts: 76
|
| Post: #10 Posted: Wed May 25, 2011 8:22 pm Post subject: |
|
|
25 May 2011.
Good Eve.
NCDEX Jun: 640.7/650.35/638.3/649.3
OI Jun: down from 134k to 128k
OI Total: Rised from 283k to 285k.
Sudden rise in KLCE Palm oil futures prices fueling the Indian market.
Square off short position today.

Doesn't seen any fundamental or technical forces for this rise, but "Market is always right"
Not taken any long position yet. Probably will take after watching market movement tomorrow.
Good Luck to all.
|
|
| Back to top |
|
|
g_kab35
White Belt
Joined: 03 May 2009
Posts: 76
|
| Post: #11 Posted: Thu May 26, 2011 7:50 pm Post subject: |
|
|
26 May 2011.
Good Evening.
NCDEX Jun: 650.9/653.3/648.1/649.6
Vol Jun: Sharply declined from 167k to 121k.
OI Jun: declined from 128k to 124k.
If u just consider price, vol & OI, then it sign about bearish mood in the market. But RSO futures mainly controlled by some biggies, so u cant fully rely on technical signals.
Its really amazed me, how marginal fluctuation in KLCE brought tsunami in Indian market sometime & stiff fall & rise in the same KLCE doesn't bothered Indian prices. But some questions are better not to be asked... 
Good Luck.
|
|
| Back to top |
|
|
g_kab35
White Belt
Joined: 03 May 2009
Posts: 76
|
| Post: #12 Posted: Fri May 27, 2011 6:08 pm Post subject: |
|
|
27 May 2011.
Good Eve.
NCDEX Jun: 653.75/659/653.3/658.2
Vol: 152k
OI:119k. (Again down)
Bull in full control. (But OI running in reverse gear.)
Speculation fueled by bad weather report in Latin America.
Previous high was around Rs. 675 in first week of Feb'11. Again...?
Good Luck.
Last edited by g_kab35 on Mon May 30, 2011 6:54 pm; edited 1 time in total |
|
| Back to top |
|
|
g_kab35
White Belt
Joined: 03 May 2009
Posts: 76
|
| Post: #13 Posted: Mon May 30, 2011 6:52 pm Post subject: |
|
|
30 May 2011.
Good Eve.
NCDEX Jun:660.2/660.2/654.35/656.8
VOl: Low volume around 107k.
OI: Down from 119k to 113k.
See the behavior of OI. Is trend reversing going on? Interesting to see next move of market.
Good Luck.
|
|
| Back to top |
|
|
ProTrader
Site Admin

Joined: 06 Jul 2008
Posts: 433
|
| Post: #14 Posted: Tue May 31, 2011 6:51 am Post subject: |
|
|
g_kab35:
Nice to see a post focused on a specific scrip and regular updates. It is much appreciated. 
Regards,
--PT
|
|
| Back to top |
|
|
g_kab35
White Belt
Joined: 03 May 2009
Posts: 76
|
| Post: #15 Posted: Tue May 31, 2011 7:03 pm Post subject: |
|
|
31 May 2011.
Good Eve.
@ Pro Trader, Thanks for appreciation.
NCDEX Jun: 656.7/664.25/656/660.95
Vol: 152k. Reached at normal level.
OI: Finally rises from 113k to 124k.
Increased OI with higher prices indicating further increment in price. Although from last 3/4 sessions closing prices get stagnate around 660/662 level, I hope last top of 670 likely to be kissed. I will not short until closing prices crosses 8 ema (which is around 645/650).
Good Luck.
|
|
| Back to top |
|
|
|


