| View previous topic :: View next topic |
| Author |
SP Strategy(+650 points PM) |
parray
White Belt

Joined: 04 Oct 2010
Posts: 102
|
Post: #1  Posted: Sun Jul 31, 2011 3:50 pm Post subject: SP Strategy(+650 points PM) Posted: Sun Jul 31, 2011 3:50 pm Post subject: SP Strategy(+650 points PM) |
 |
|
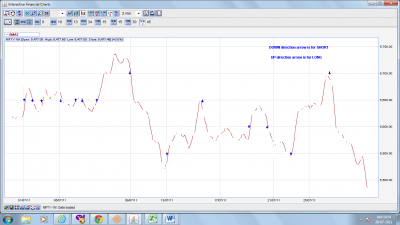
Subject strategy is quite simple user no need to be an expert in Technical Analysis. In this strategy you need to focus only on single trend line called SMA3 in 2 minute tf and 30 seconds TF without any candles.
Past one and half years strategy delivered an average +650 points per month (signal to signal) in Nifty (Not tested for any other futures and equities). Best month was Jun'11 where total points +750 and worst month was July'11 only +250 points signal to signal (overall points are +800).
Process:
Set up
1) Select J-Charts (Premium)
2) Select Nifty 1 Month
3) Select 2 mnt TF
4) Select colour panel
5) Select white colour for first three candles (price, Bullish and Bearish) with this set up u will not see any candles in charts and this helps you to stick to single indicator and you will not react to fast changing candles.
Entry and Exit:
6) When SMA3 line crosses xx50 or x100 (consider only these two points for entry and exits ) from down side to upside ( ie 5550 or 5600) then go LONG or If line moves from upside to down then go short and use the same principle to to exit long or short (Check the attached chart to understand the process better)
7) Once position is in profit you can consider to exit from position using 30 seconds TF as 2 Minute TF you will not see quick reversal of the trend. In order to be safe side you can consider to exit once nifty close to +50 or +100 level without waiting for SMA3 crossing or rejection of trend.
My humble request if you are making money using this strategy kindly donate 10% of your profits to poor children who want pursue the education or plant trees around your area.
May god bless you with peace and love.
|
|
| Back to top |
|
 |
|
|
|
Rahulsharmaat
Black Belt

Joined: 04 Nov 2009
Posts: 2766
|
| Post: #2 Posted: Sun Jul 31, 2011 4:24 pm Post subject: |
|
|
| there is no attached chart here -- please attach -- and detail --when to buy n short-- rest all i have set on 2 TF chart
|
|
| Back to top |
|
|
Rahulsharmaat
Black Belt
Joined: 04 Nov 2009
Posts: 2766
|
| Post: #3 Posted: Sun Jul 31, 2011 4:25 pm Post subject: |
|
|
| what is When SMA3 line crosses xx50 or x100 ?????
|
|
| Back to top |
|
|
Rahulsharmaat
Black Belt
Joined: 04 Nov 2009
Posts: 2766
|
| Post: #4 Posted: Sun Jul 31, 2011 4:32 pm Post subject: |
|
|
| there is a green faded line--- on the chart-- and value of nifty other side-- detail how to do it ??
|
|
| Back to top |
|
|
Rahulsharmaat
Black Belt
Joined: 04 Nov 2009
Posts: 2766
|
| Post: #5 Posted: Sun Jul 31, 2011 5:29 pm Post subject: |
|
|
now what will be the stop loss --once trade is done---
As looking to friday trade -- it has done atleast 5 Stop loss
|
|
| Back to top |
|
|
Rahulsharmaat
Black Belt
Joined: 04 Nov 2009
Posts: 2766
|
| Post: #6 Posted: Sun Jul 31, 2011 5:38 pm Post subject: |
|
|
| and 9 on thrusday --SL -- as this line moves up n down 5500-- so many times
|
|
| Back to top |
|
|
KIRAN0121
White Belt
Joined: 27 Apr 2011
Posts: 1
|
| Post: #7 Posted: Sun Jul 31, 2011 7:01 pm Post subject: |
|
|
| can you provide attachment
|
|
| Back to top |
|
|
manass
White Belt
Joined: 21 Sep 2009
Posts: 172
|
| Post: #8 Posted: Sun Jul 31, 2011 11:48 pm Post subject: Re: SP Strategy(+650 points PM) |
|
|
hi Parry, please provide attachment & chart for a better understanding of others.
Regards
|
|
| Back to top |
|
|
parray
White Belt
Joined: 04 Oct 2010
Posts: 102
|
| Post: #9 Posted: Mon Aug 01, 2011 9:44 am Post subject: |
|
|
attachments in .docs & xlsx not accepting, try to post the same after trading hours.
Rahul - SMA3 in 2tf is more stable u will not get many whipsaws even in the morning.
|
|
| Back to top |
|
|
prabit
White Belt
Joined: 02 Jul 2009
Posts: 133
|
| Post: #10 Posted: Mon Aug 01, 2011 10:50 am Post subject: |
|
|
Hi parray,
Thanks for sharing your strategy. 650 points pm astounding. This must be intraday strategy?
|
|
| Back to top |
|
|
satishb
White Belt
Joined: 01 Mar 2009
Posts: 13
|
| Post: #11 Posted: Mon Aug 01, 2011 2:23 pm Post subject: |
|
|
Hi PARRAY,
Can U please make your strategy a bit more clear,
Some of us are not very familiar with technical terminologies,
So need more hand holding to grasp,
Also no chart attached as U mentioned
|
|
| Back to top |
|
|
parray
White Belt
Joined: 04 Oct 2010
Posts: 102
|
| Post: #12 Posted: Mon Aug 01, 2011 3:08 pm Post subject: |
|
|
july chart
| Description: |
|
| Filesize: |
127.52 KB |
| Viewed: |
1130 Time(s) |
|
|
|
| Back to top |
|
|
parray
White Belt
Joined: 04 Oct 2010
Posts: 102
|
| Post: #13 Posted: Mon Aug 01, 2011 3:21 pm Post subject: |
|
|
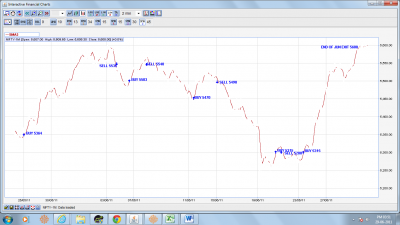
June Chart
| Description: |
|
| Filesize: |
128.73 KB |
| Viewed: |
1045 Time(s) |
|
|
|
| Back to top |
|
|
Rahulsharmaat
Black Belt
Joined: 04 Nov 2009
Posts: 2766
|
| Post: #14 Posted: Mon Aug 01, 2011 3:42 pm Post subject: |
|
|
so logic is we dont have to see 5500-- 5550--5600--
when ever this line cross-- X100---or XX50-- from down side--- when line have crossed-- buy nifty value may be 5- 10 points higher then Example-- if cross 5500-- it may be 5510 also--when u buy-- wait till it cross X100--XX50 from upside-- no need to exit in between-
thanks
|
|
| Back to top |
|
|
parray
White Belt
Joined: 04 Oct 2010
Posts: 102
|
| Post: #15 Posted: Mon Aug 01, 2011 4:00 pm Post subject: |
|
|
u r understanding is correct, situation like today. if u r long first thing is to get out of the position as it jumped from low of 5500 to 5550 level and took the reverse direction ( without waiting for line to cross in the chart)
sma3 lines takes time to reach absolute line level as mentioned - r + 5 to 10 points.
scenario like today fast enough and taken the short side @ 5550 then just watch 30 seconds tf to cross either side 5550 (to exit the short and re-enter the long ) or 5500 to book the profit in short both happened today and line moved the line back to long zone.
wish u all the best mint the money.
|
|
| Back to top |
|
|
|


