| View previous topic :: View next topic |
| Author |
Stochastic 39 |
chrome
Yellow Belt

Joined: 28 Dec 2009
Posts: 645
|
Post: #1  Posted: Sat Sep 04, 2010 2:09 pm Post subject: Stochastic 39 Posted: Sat Sep 04, 2010 2:09 pm Post subject: Stochastic 39 |
 |
|
Trading style : Positional, Investors, Medium term holdings.
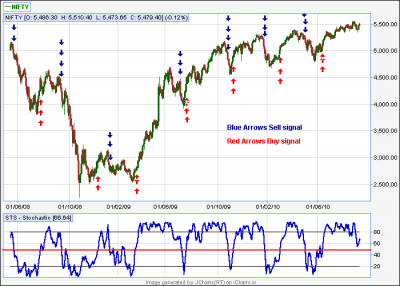
Stochastic settings 39,0,0
if Charts not let u make 0,0 then one can take it as 1 or 2 also but check the blue line of 39 (%K) only for interpretation.
Go Long when Slow Stochastic (39) comes from bottom to upside and cross 50 level.
Similarly shorts can be initiated when Slow Stochastic (39) comes from upside to downwards and cross 50 level.
One can keep the position open when the STS moves in overbought/ oversold zone also. The position should be covered only when the reverse 50 level happens. (eg. in case of long trade when STS again comes from upside to downside and crosses 50, then only the long position should be closed.)
In the attached Nifty chart one can interpret that in bear market Sell signals were very profitable and now in bull market buy signals are the more profitable one's...so as per the market cycle one can chose to go long or short with this model.
| Description: |
|
| Filesize: |
27.79 KB |
| Viewed: |
1518 Time(s) |

|
|
|
| Back to top |
|
 |
|
|
 |
chetan83
Brown Belt

Joined: 19 Feb 2010
Posts: 2037
|
Post: #2  Posted: Sat Sep 04, 2010 2:51 pm Post subject: Very informative Posted: Sat Sep 04, 2010 2:51 pm Post subject: Very informative |
 |
|
Hi Crome,
Will the given set up work for Commodity as well? Is the set-up seen in Hourly, Daily charts or 60 mins charts as well. Pls educate.
|
|
| Back to top |
|
 |
chrome
Yellow Belt

Joined: 28 Dec 2009
Posts: 645
|
Post: #3  Posted: Sat Sep 04, 2010 5:31 pm Post subject: Re: Very informative Posted: Sat Sep 04, 2010 5:31 pm Post subject: Re: Very informative |
 |
|
| chetan83 wrote: | Hi Crome,
Will the given set up work for Commodity as well? Is the set-up seen in Hourly, Daily charts or 60 mins charts as well. Pls educate. |
Hi Chetan
I tried in EOD charts for stocks and results are good. Havn't backtested on smaller time frames yet on stocks.
For commodities also havn't backtested yet.
will let u know soon after testing on smaller timeframes 
|
|
| Back to top |
|
 |
chrome
Yellow Belt

Joined: 28 Dec 2009
Posts: 645
|
Post: #4  Posted: Fri Sep 24, 2010 3:38 pm Post subject: ABAN Posted: Fri Sep 24, 2010 3:38 pm Post subject: ABAN |
 |
|
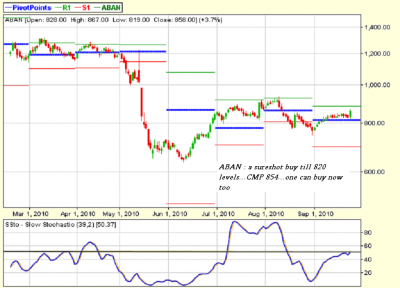
ABAN : a sureshot buy till 820 levels...CMP 854...one can buy now too
| Description: |
|
| Filesize: |
91.16 KB |
| Viewed: |
960 Time(s) |

|
|
|
| Back to top |
|
 |
will_recover
White Belt

Joined: 19 Aug 2010
Posts: 55
|
Post: #5  Posted: Fri Sep 24, 2010 3:42 pm Post subject: Re: ABAN Posted: Fri Sep 24, 2010 3:42 pm Post subject: Re: ABAN |
 |
|
| chrome wrote: | | ABAN : a sureshot buy till 820 levels...CMP 854...one can buy now too |
whats the target and what should be the sl
|
|
| Back to top |
|
 |
chrome
Yellow Belt

Joined: 28 Dec 2009
Posts: 645
|
Post: #6  Posted: Fri Sep 24, 2010 4:17 pm Post subject: Re: ABAN Posted: Fri Sep 24, 2010 4:17 pm Post subject: Re: ABAN |
 |
|
| will_recover wrote: | | chrome wrote: | | ABAN : a sureshot buy till 820 levels...CMP 854...one can buy now too |
whats the target and what should be the sl |
SL one can keep below 810...any dip till 820 is an buying opportunity...I preffer delivery trading only so will update for the target/ partial booking later on
|
|
| Back to top |
|
 |
chrome
Yellow Belt

Joined: 28 Dec 2009
Posts: 645
|
|
| Back to top |
|
 |
tnandkumar
White Belt

Joined: 04 Jan 2010
Posts: 19
|
Post: #8  Posted: Thu Sep 30, 2010 6:55 am Post subject: Posted: Thu Sep 30, 2010 6:55 am Post subject: |
 |
|
hi chrome sir,
very simple strategy to follow. i have checked with commodities and index charts it works very well,but i have few queries ,which time frame charts have to be followed (5,15,30,1hr,4hr or daily),can we add one more indicator like RSI for confirmation at 50 level crossing area.thanks in advance
|
|
| Back to top |
|
 |
chrome
Yellow Belt

Joined: 28 Dec 2009
Posts: 645
|
Post: #9  Posted: Thu Sep 30, 2010 10:38 am Post subject: Posted: Thu Sep 30, 2010 10:38 am Post subject: |
 |
|
| tnandkumar wrote: | hi chrome sir,
very simple strategy to follow. i have checked with commodities and index charts it works very well,but i have few queries ,which time frame charts have to be followed (5,15,30,1hr,4hr or daily),can we add one more indicator like RSI for confirmation at 50 level crossing area.thanks in advance |
Hi, I trade based on daily/ weekly charts with SS39..Intraday need to be checked..
yes, u can take confirmation from other indicators like RSI, MACD or any EMA crossover..it will double the chances of succesful trade.
|
|
| Back to top |
|
 |
tnandkumar
White Belt

Joined: 04 Jan 2010
Posts: 19
|
Post: #10  Posted: Thu Sep 30, 2010 11:09 am Post subject: Posted: Thu Sep 30, 2010 11:09 am Post subject: |
 |
|
| thanks for ur prompt reply chrome,can u suggest which EMA will be good to trade for commdities.right now i am using 8,34 EMA for trading commodities intraday 15 min charts with pivot points.can we follow the one suggested in the forum (5 min,107 and 200 EMA) or for taking poisitions in commodities can we used any proven EMA crossovers.
|
|
| Back to top |
|
 |
smartcancerian
Yellow Belt

Joined: 07 Apr 2010
Posts: 542
|
Post: #11  Posted: Thu Sep 30, 2010 7:22 pm Post subject: Posted: Thu Sep 30, 2010 7:22 pm Post subject: |
 |
|
| tnandkumar wrote: | | thanks for ur prompt reply chrome,can u suggest which EMA will be good to trade for commdities.right now i am using 8,34 EMA for trading commodities intraday 15 min charts with pivot points.can we follow the one suggested in the forum (5 min,107 and 200 EMA) or for taking poisitions in commodities can we used any proven EMA crossovers. |
Tanand kumar..which commodities work well on 8/34...& how do you add/calculate pivots..pl educate..
Thanx in advance..
Smartcancerian
|
|
| Back to top |
|
 |
chrome
Yellow Belt

Joined: 28 Dec 2009
Posts: 645
|
Post: #12  Posted: Fri Oct 01, 2010 9:58 am Post subject: STER Posted: Fri Oct 01, 2010 9:58 am Post subject: STER |
 |
|
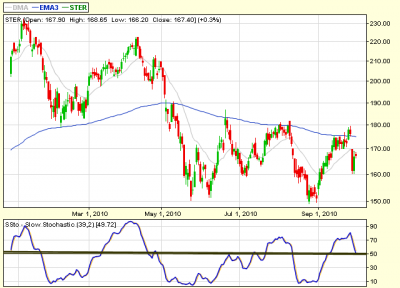
STER : 166 immediate support & 169 immediate resistance.
SS-39 is at crucial levels of 50 now. STER is finding stiff resistance @ 200 EMA since May-10.
If today closes above 169, the a buy candidate and if closes below 165, then a downside cadidate.
| Description: |
|
| Filesize: |
24.57 KB |
| Viewed: |
695 Time(s) |

|
|
|
| Back to top |
|
 |
chrome
Yellow Belt

Joined: 28 Dec 2009
Posts: 645
|
Post: #13  Posted: Fri Oct 01, 2010 2:48 pm Post subject: Re: STER Posted: Fri Oct 01, 2010 2:48 pm Post subject: Re: STER |
 |
|
| chrome wrote: | STER : 166 immediate support & 169 immediate resistance.
SS-39 is at crucial levels of 50 now. STER is finding stiff resistance @ 200 EMA since May-10.
If today closes above 169, the a buy candidate and if closes below 165, then a downside cadidate. |
zoooommmm....175 intraday 
|
|
| Back to top |
|
 |
tnandkumar
White Belt

Joined: 04 Jan 2010
Posts: 19
|
Post: #14  Posted: Fri Oct 01, 2010 10:20 pm Post subject: Posted: Fri Oct 01, 2010 10:20 pm Post subject: |
 |
|
hi smartcancerian,
to be very frank i am also new to trading commodities,but 8 and 34 work well for all metal commofities,but i hope signal r a bit delayed,i am planing to test it with 8 and 21 EMA and confirmation frm 34 EMa (still in testing process),and about pivot point indicators u can download GCI or Fxcentral demo accounts from google.here u can add real time indicators which work live.
|
|
| Back to top |
|
 |
chrome
Yellow Belt

Joined: 28 Dec 2009
Posts: 645
|
Post: #15  Posted: Wed Oct 13, 2010 10:31 am Post subject: Re: STER Posted: Wed Oct 13, 2010 10:31 am Post subject: Re: STER |
 |
|
| chrome wrote: | | chrome wrote: | STER : 166 immediate support & 169 immediate resistance.
SS-39 is at crucial levels of 50 now. STER is finding stiff resistance @ 200 EMA since May-10.
If today closes above 169, the a buy candidate and if closes below 165, then a downside cadidate. |
zoooommmm....175 intraday  |
STER nicely moving up ..181 now 
|
|
| Back to top |
|
 |
|

