| View previous topic :: View next topic |
| Author |
Stocks Positional Calls |
gmdriyaz
White Belt

Joined: 05 Apr 2007
Posts: 7
|
Post: #151  Posted: Sun Jan 17, 2010 6:59 pm Post subject: CALCULATION OF KALYANI STEEL Posted: Sun Jan 17, 2010 6:59 pm Post subject: CALCULATION OF KALYANI STEEL |
 |
|
hi hansraj
I am giving calculation for kalyani with pole formation dates and flag breakout with calculation of Target and SL
pls check and comment
Stock - KALYANI STEEL
Pattern - Flag
Target Calculation Example :
Pole Low - 127.90 (13/11/2009)
Pole High - 170.50 (26/11/2009)
Flag Breakout - 208.90 on 15/01/2010
Target - 171-128 = 43 points
From the Low of 15/01/2010
i.e. 188 + 43 = 231
Stoploss Calculation :
Open = 192
Close = 209
so SL : 199
Note : SL is 2-3 points below the median irrespective of the price of stock whether it is 500 or 50.
thanks
riyaz
|
|
| Back to top |
|
 |
|
|
 |
hansraj456
White Belt

Joined: 17 Nov 2009
Posts: 370
|
|
| Back to top |
|
 |
hansraj456
White Belt

Joined: 17 Nov 2009
Posts: 370
|
Post: #153  Posted: Sun Jan 17, 2010 7:13 pm Post subject: Re: CALCULATION OF KALYANI STEEL Posted: Sun Jan 17, 2010 7:13 pm Post subject: Re: CALCULATION OF KALYANI STEEL |
 |
|
| gmdriyaz wrote: | hi hansraj
I am giving calculation for kalyani with pole formation dates and flag breakout with calculation of Target and SL
pls check and comment
Stock - KALYANI STEEL
Pattern - Flag
Target Calculation Example :
Pole Low - 127.90 (13/11/2009)
Pole High - 170.50 (26/11/2009)
Flag Breakout - 208.90 on 15/01/2010
Target - 171-128 = 43 points
From the Low of 15/01/2010
i.e. 188 + 43 = 231
Stoploss Calculation :
Open = 192
Close = 209
so SL : 199
Note : SL is 2-3 points below the median irrespective of the price of stock whether it is 500 or 50.
thanks
riyaz |
Pole High is 188. actually it was black candle for pole high so take high in that case.
|
|
| Back to top |
|
 |
RAJASIMHAN
White Belt

Joined: 15 Mar 2009
Posts: 13
|
Post: #154  Posted: Sun Jan 17, 2010 7:24 pm Post subject: Posted: Sun Jan 17, 2010 7:24 pm Post subject: |
 |
|
Hi Hans,
Thank you so much for your speedy reply
RAJASIMHAN   
|
|
| Back to top |
|
 |
Ravi_S
Yellow Belt

Joined: 15 Jun 2009
Posts: 569
|
Post: #155  Posted: Sun Jan 17, 2010 8:39 pm Post subject: Posted: Sun Jan 17, 2010 8:39 pm Post subject: |
 |
|
Hansraj
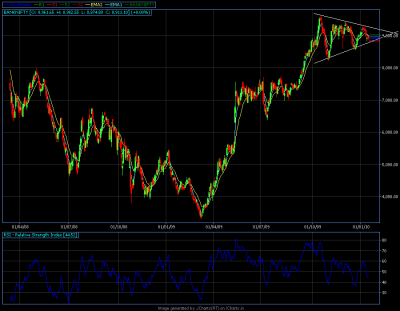
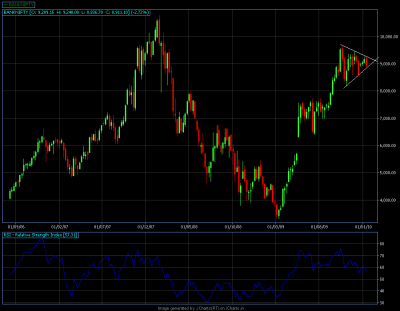
Sorry for posting in this forum, but since we were discussing Flag and Pennant formation, I would post this... I noticed a flag and pennant formation in Bank Nifty... Is this valid? Pls reply...
Regards
Ravi 
| Description: |
|
| Filesize: |
24.22 KB |
| Viewed: |
341 Time(s) |

|
| Description: |
|
| Filesize: |
17.82 KB |
| Viewed: |
301 Time(s) |

|
|
|
| Back to top |
|
 |
hansraj456
White Belt

Joined: 17 Nov 2009
Posts: 370
|
Post: #156  Posted: Sun Jan 17, 2010 9:44 pm Post subject: Posted: Sun Jan 17, 2010 9:44 pm Post subject: |
 |
|
| Ravi_S wrote: | Hansraj
Sorry for posting in this forum, but since we were discussing Flag and Pennant formation, I would post this... I noticed a flag and pennant formation in Bank Nifty... Is this valid? Pls reply...
Regards
Ravi  |
No. it is not valid, bullish flag will be confirmed only when it closes above 9630 with substantial volume. Let's see when it happens. For the timebeing banknifty seems to be in bearish mode.
Please never feel sorry for posting in this forum.
Thanks
|
|
| Back to top |
|
 |
chandrujimrc
Brown Belt

Joined: 21 Apr 2009
Posts: 1683
|
Post: #157  Posted: Sun Jan 17, 2010 10:32 pm Post subject: stocks positional calls Posted: Sun Jan 17, 2010 10:32 pm Post subject: stocks positional calls |
 |
|
Hi Kripalsinh,
Can You explain the details of software and name of the web site which you have mentioned in your earlier post.
Ravi. 
|
|
| Back to top |
|
 |
harshkapoor3
White Belt

Joined: 19 Feb 2009
Posts: 33
|
Post: #158  Posted: Sun Jan 17, 2010 11:09 pm Post subject: Posted: Sun Jan 17, 2010 11:09 pm Post subject: |
 |
|
[quote="hansraj456"]Hi Harsh
Selection of stocks is been very successful till date. Can you help me in intraday trading, if you do.
Hi Hans,
If you read this ,
Flagpole: The flagpole is the distance from the first resistance or support break to the high or low of the flag/pennant. The sharp advance (or decline) that forms the flagpole should break a trend line or resistance/support level. A line extending up from this break to the high of the flag/pennant forms the flagpole.
Hence it means that the flag pole for nmdc is the low on nov 9 , pls comment on the same
I requested you to check nifty , i think it as a ascending triangle.
As far as daily trading is concerned i came across a thery on that, should we start a new thread for that. ?
mkk
|
|
| Back to top |
|
 |
harshkapoor3
White Belt

Joined: 19 Feb 2009
Posts: 33
|
Post: #159  Posted: Sun Jan 17, 2010 11:17 pm Post subject: Re: stocks positional calls Posted: Sun Jan 17, 2010 11:17 pm Post subject: Re: stocks positional calls |
 |
|
| chandrujimrc wrote: | Hi Kripalsinh,
Can You explain the details of software and name of the web site which you have mentioned in your earlier post.
Ravi.  |
Hi kripal
I am also waiting for ur update on the website, of which u spoke abt .
|
|
| Back to top |
|
 |
sdeepa
White Belt

Joined: 08 Aug 2009
Posts: 47
|
Post: #160  Posted: Sun Jan 17, 2010 11:39 pm Post subject: Reg.Flag Pattern Posted: Sun Jan 17, 2010 11:39 pm Post subject: Reg.Flag Pattern |
 |
|
Dear Mr.Hansraj,
Many thanks for posting the Bullish Flag Pattern chart in this forum and I really admired your contribution to this forum. I also would like to say that as per your recommendation I invested in NFL and it is in profit mode. I assure you that I will contribute from the profit as per your request though I am already doing but this will treat it as seperately.
Actually Bullish flag pattern I followed in my 20min charts but after seeing your chart I corrected myself into EOD charts.
I convey my sincere thanks once again.
Kind Regards,
S.Deepa
|
|
| Back to top |
|
 |
girishhu1
White Belt

Joined: 17 Aug 2009
Posts: 316
|
Post: #161  Posted: Mon Jan 18, 2010 5:47 am Post subject: positional calls Posted: Mon Jan 18, 2010 5:47 am Post subject: positional calls |
 |
|
The stocks recommended are not available on i-chats list. pls guide how can c charts of these stocks- nmdc, basf, century enka , kalyani steel? plz, plz help. 
|
|
| Back to top |
|
 |
hansraj456
White Belt

Joined: 17 Nov 2009
Posts: 370
|
Post: #162  Posted: Mon Jan 18, 2010 7:03 am Post subject: Posted: Mon Jan 18, 2010 7:03 am Post subject: |
 |
|
[quote="harshkapoor3"] | hansraj456 wrote: | Hi Harsh
Selection of stocks is been very successful till date. Can you help me in intraday trading, if you do.
Hi Hans,
If you read this ,
Flagpole: The flagpole is the distance from the first resistance or support break to the high or low of the flag/pennant. The sharp advance (or decline) that forms the flagpole should break a trend line or resistance/support level. A line extending up from this break to the high of the flag/pennant forms the flagpole.
Hence it means that the flag pole for nmdc is the low on nov 9 , pls comment on the same
I requested you to check nifty , i think it as a ascending triangle.
As far as daily trading is concerned i came across a thery on that, should we start a new thread for that. ?
mkk |
No. I consider the low and high of pole which is visible on chart, i don't give any importance to support/resistence levels. For the last one year I have been selecting the stocks in this way only and more than 80% stocks have been selected on the basis of flag pattern only and it has been most successful pattern for me.
For nifty you are right it is ascending triangle, but breakout is not there, so we need to wait. We shall not presume that something is going to happen because it may turn on other side also. So give an attention to Nifty only if there is a breakout, otherwise nothing doing with that. I am trading nifty only through hedging or swing. No trading on the basis of chart patterns as most of the time it goes other side of the expectations.
Please start a new thread for Intraday trading tactics and share your valuable points.
Thanks
Last edited by hansraj456 on Mon Jan 18, 2010 7:25 am; edited 1 time in total |
|
| Back to top |
|
 |
hansraj456
White Belt

Joined: 17 Nov 2009
Posts: 370
|
Post: #163  Posted: Mon Jan 18, 2010 7:15 am Post subject: Re: positional calls Posted: Mon Jan 18, 2010 7:15 am Post subject: Re: positional calls |
 |
|
| girishhu1 wrote: | The stocks recommended are not available on i-chats list. pls guide how can c charts of these stocks- nmdc, basf, century enka , kalyani steel? plz, plz help.  |
it is not available at Jcharts. But it is available at 'Charts' or 'Charts (Premium) links. Please follow these links and search for these stocks.
Thanks
|
|
| Back to top |
|
 |
hansraj456
White Belt

Joined: 17 Nov 2009
Posts: 370
|
Post: #164  Posted: Mon Jan 18, 2010 7:47 am Post subject: Why retail Investor loose his money in share market? Posted: Mon Jan 18, 2010 7:47 am Post subject: Why retail Investor loose his money in share market? |
 |
|
Why retail Investor loose his money in share market?
> He is among the last few people to enter into the Bull Run.
> Never put the Stop Loss in the System.
> Always the first one to exit from stock which are in Bull Run, with minimum profit.
> By doing the emotional Trading.Holding the positions in Loss and cutting down the positions in profit
> Lack of home work before entering in a stock.
> Too much greed from a single Stock.
> Day dreaming in stock market also makes him suffer huge losses.
|
|
| Back to top |
|
 |
Ravi_S
Yellow Belt

Joined: 15 Jun 2009
Posts: 569
|
Post: #165  Posted: Mon Jan 18, 2010 7:47 am Post subject: Re: stocks positional calls Posted: Mon Jan 18, 2010 7:47 am Post subject: Re: stocks positional calls |
 |
|
Chandrujimrc : you have faked my signature....
| chandrujimrc wrote: | Hi Kripalsinh,
Can You explain the details of software and name of the web site which you have mentioned in your earlier post.
Ravi.  |
|
|
| Back to top |
|
 |
|

