| View previous topic :: View next topic |
| Author |
STS Devergence |
Padkondu
White Belt

Joined: 23 Jan 2008
Posts: 120
|
Post: #1  Posted: Mon Dec 12, 2011 11:57 pm Post subject: STS Devergence Posted: Mon Dec 12, 2011 11:57 pm Post subject: STS Devergence |
 |
|
Hi ichartians.
divergences are of two types
1. Regular divergence - which indicates the reversal of existing trend.
2. Hidden divergence - which indicates the continuation of existing trend and provides an opportunity to capture the tops in down trends or bottoms in up trends, after a pull back.
Hidden divergence:
during a down trend the price usually makes a lower highs, hidden divergence occurs when an oscillator like sts or rsi makes a higher high. this provides an opportunity to sell at the top of the pullback.
similarly, during an up trend, price usually makes higher lows. hidden divergence occurs when the oscillator makes a lower lows providing an opportunity to buy at the bottoms of the correction.
hidden divergence is not a regular happening after each lower low or a higher high, but when it takes place it can be seen as an opportunity to ride on the trend. one has to ensure an existing trend before it. it fails during sideways or ranged markets
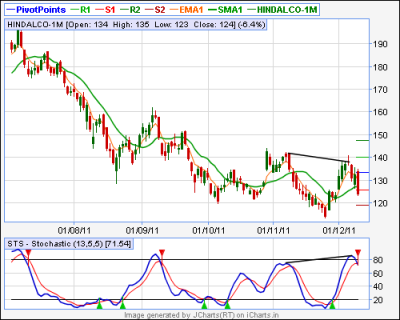
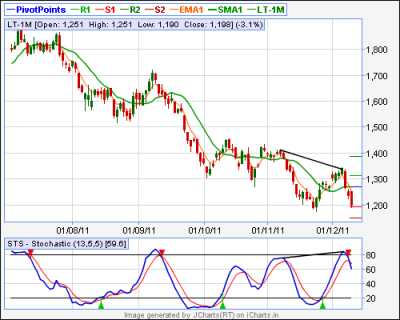
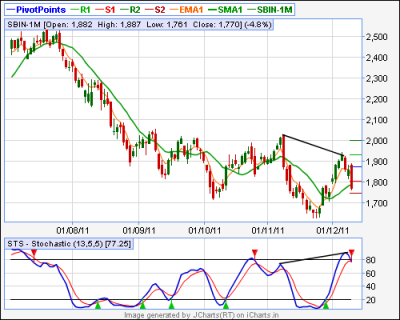
here i post an eod chart of SBIN futures, which is showing hidden divergence, i shorted before closing of the market basing on this system. on can cosider to paper trade this on the opening of tomarrow with a stop just above the swing high i.e. 1942.
regards.
Padkondu
| Description: |
|
| Filesize: |
19.68 KB |
| Viewed: |
542 Time(s) |
|
| Description: |
|
| Filesize: |
19.01 KB |
| Viewed: |
517 Time(s) |
|
| Description: |
|
| Filesize: |
19.61 KB |
| Viewed: |
546 Time(s) |
|
Last edited by Padkondu on Tue Dec 13, 2011 12:51 am; edited 1 time in total |
|
| Back to top |
|
 |
|
| |
sandew
White Belt
Joined: 02 Feb 2009
Posts: 174
|
| Post: #2 Posted: Tue Dec 13, 2011 7:43 am Post subject: Nice |
|
|
Hidden divergence many miss.
Nice post
|
|
| Back to top |
|
|
Padkondu
White Belt
Joined: 23 Jan 2008
Posts: 120
|
| Post: #3 Posted: Tue Dec 13, 2011 7:53 am Post subject: Re: Nice |
|
|
| sandew wrote: | Hidden divergence many miss.
Nice post |
Hi Sandew.
Yes, many miss. while trading divergence one has to have patience and wait for the cue that divergence is likely to work. one cue with hidden divergence with sts indicator is the beairsh crossover of %K and %D lines or sell signal at ob region. i too do not hv much experience with hidden divergence. so let me work on this for some time before adding it into my strategies.
Padkondu
|
|
| Back to top |
|
|
vinay28
Black Belt

Joined: 24 Dec 2010
Posts: 11748
|
| Post: #4 Posted: Tue Dec 13, 2011 8:48 am Post subject: |
|
|
"2. Hidden divergence - which indicates the continuation of existing trend and provides an opportunity to capture the tops in down trends or bottoms in up trends, after a pull back."
Padkondu
Somewhere I read that, in case of hidden divergences, "capturing the tops in down trends or bottoms in up trends" applies to tops and bottoms in the indicators and not the price.
Pl correct me if I am wrong!
|
|
| Back to top |
|
|
Padkondu
White Belt
Joined: 23 Jan 2008
Posts: 120
|
| Post: #5 Posted: Tue Dec 13, 2011 10:15 am Post subject: |
|
|
| vinay28 wrote: | "2. Hidden divergence - which indicates the continuation of existing trend and provides an opportunity to capture the tops in down trends or bottoms in up trends, after a pull back."
Padkondu
Somewhere I read that, in case of hidden divergences, "capturing the tops in down trends or bottoms in up trends" applies to tops and bottoms in the indicators and not the price.
Pl correct me if I am wrong! |
Hi vinay28.
I do not have much experience with divergences. I use divergence to take extra care or avoid a trade using the old usual MTT system and i only do swing trading.
from the articles i read over internet on divergences, a perfect divergence is the one that makes simultaneous tops and or bottoms with price. by saying capturing top or bottom, i do not exactly mean to topmost or bottommost price on the chart but earliest possible entry. even with divergence one has to show patience for finding evidence that the divergence is in action before taking entry. i too will try to find aa better answer fo your query.
regards
padkondu
|
|
| Back to top |
|
|
Padkondu
White Belt
Joined: 23 Jan 2008
Posts: 120
|
| Post: #6 Posted: Thu Dec 15, 2011 12:14 pm Post subject: hidden divergence of sts at work |
|
|
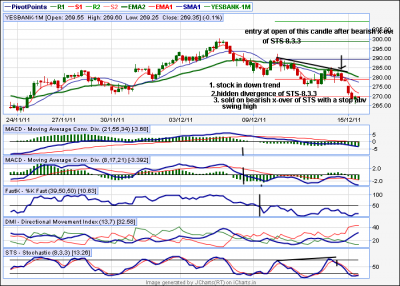
I shorted yes bank futs basing on the hidden divergence in yes bank in 60min timeframe. previously i posted hidden divergence in eod chart - which performed somewhat o.k. now my stop loss is just above the high of hammer.
i am only experimenting with this. this seems to be working. but not enough to include in this as one of my trading strategies.
need valuble openion of experts.
regards
Padkondu
| Description: |
|
| Filesize: |
40.59 KB |
| Viewed: |
563 Time(s) |
|
|
|
| Back to top |
|
|
|
|
You cannot post new topics in this forum
You cannot reply to topics in this forum
You cannot edit your posts in this forum
You cannot delete your posts in this forum
You cannot vote in polls in this forum
You can attach files in this forum
You can download files in this forum
|
Powered by phpBB © 2001, 2005 phpBB Group
|
|


