| View previous topic :: View next topic |
| Author |
Super trading HDIL with super trend |
amitkbaid1008
Yellow Belt

Joined: 04 Mar 2009
Posts: 540
|
Post: #151  Posted: Tue Jan 01, 2013 10:21 pm Post subject: Posted: Tue Jan 01, 2013 10:21 pm Post subject: |
 |
|
| Amitsh27 wrote: | Dear intra bro,
I understood the ST set up and 5 min TF thing but i dnt understand how to bu sell by looking at chart.....can you explain green/red lines and the entry exit strategy pls....many thanks !
Rgds
Amt |
Dear Amitsh27
Though this is not my thread but what I can see in the charts I can well explain it to you.
The Bright Green Line in EMA(34) as mentioned in the Chart itself.
Red and Dark Green line is Super Trend (ST) Line which is Red when it is below the price and Green when it is above the price which means when ST line is green you are short and when ST line is red you are long
|
|
| Back to top |
|
 |
|
|
|
sauraj123
White Belt

Joined: 10 Jan 2012
Posts: 312
|
| Post: #152 Posted: Tue Jan 01, 2013 11:25 pm Post subject: |
|
|
Please anyone.
for IDFC,HDIL what is the ST value(5,2)? EMA? and what time frame?
and also where to book first lot?
|
|
| Back to top |
|
|
intra.trader
White Belt
Joined: 25 Sep 2012
Posts: 402
|
| Post: #153 Posted: Wed Jan 02, 2013 12:50 pm Post subject: |
|
|
| sauraj123 wrote: | Please anyone.
for IDFC,HDIL what is the ST value(5,2)? EMA? and what time frame?
and also where to book first lot? |
I am trading HDIL using 6 min chart with 5,2 and 34 ema...since i trade on cash i cover my 50 % trades @ .60pasia rest @ reverse...If in short coevr @ end of market, i do not enter into short trades after 2.45..i am long i jst cover them..do not take any trade where ST is 2 points far when we take the point for trade..
|
|
| Back to top |
|
|
intra.trader
White Belt
Joined: 25 Sep 2012
Posts: 402
|
|
| Back to top |
|
|
Amitsh27
White Belt
Joined: 20 Dec 2012
Posts: 47
|
| Post: #155 Posted: Wed Jan 02, 2013 1:07 pm Post subject: |
|
|
Dear Intra Trader,
I'm still confused & not satisfied with the answer i got...can you l explain things like what to look, when to enter/exit....candles, lines, crossovers etc etc. I normally trade in FnO.
Thanks !
Amit
|
|
| Back to top |
|
|
intra.trader
White Belt
Joined: 25 Sep 2012
Posts: 402
|
| Post: #156 Posted: Wed Jan 02, 2013 1:22 pm Post subject: |
|
|
| Amitsh27 wrote: | Dear Intra Trader,
I'm still confused & not satisfied with the answer i got...can you l explain things like what to look, when to enter/exit....candles, lines, crossovers etc etc. I normally trade in FnO.
Thanks !
Amit |
BUY SIGNAL:
Buy when price moves above Super-Trend (i.e. shows Red color from green) and candle closes above line. If you want, take double confirmation with EMA(34) above the prices on
SELL SIGNAL:
Sell when price moves below Super-Trend (i.e. shows Green color from red..) and candle closes below the line. If you want take double confirmation with EMA(34) below the prices on 5 min charts.
hope this should more clear...
|
|
| Back to top |
|
|
Arul Zen
White Belt
Joined: 23 Jan 2008
Posts: 38
|
| Post: #157 Posted: Wed Jan 02, 2013 9:41 pm Post subject: |
|
|
thanks for your ST indicator
I have one doubt.. why you exit 50% at .60 paise for hdil.. is there any calculations.. is there any reason behind .60 paise
Thanks
Arul
|
|
| Back to top |
|
|
intra.trader
White Belt
Joined: 25 Sep 2012
Posts: 402
|
| Post: #158 Posted: Thu Jan 03, 2013 9:52 am Post subject: |
|
|
| Arul Zen wrote: | thanks for your ST indicator
I have one doubt.. why you exit 50% at .60 paise for hdil.. is there any calculations.. is there any reason behind .60 paise
Thanks
Arul |
its not mine.it belongs to icharts 
there is not exact logic..since this indicator is based on ATR and if i put ATR 5(since 5 days of trading a week) and average comes out to be in between 65 to 50 paisa, so i book 50 % @ around 60 paisa..
|
|
| Back to top |
|
|
intra.trader
White Belt
Joined: 25 Sep 2012
Posts: 402
|
| Post: #159 Posted: Thu Jan 03, 2013 9:56 am Post subject: |
|
|
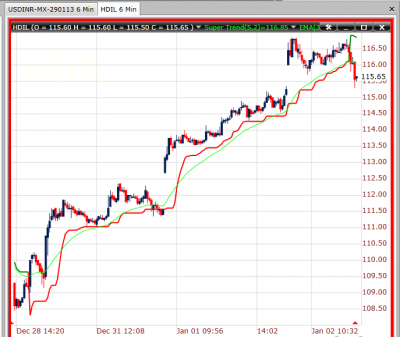
| if you see i got nice entry of short @ 115.80 covered 50 % @ 115.20 now will reverse position when 6 min candle close above 116.20
|
|
| Back to top |
|
|
Amitsh27
White Belt
Joined: 20 Dec 2012
Posts: 47
|
| Post: #160 Posted: Thu Jan 03, 2013 11:25 am Post subject: |
|
|
| intra.trader wrote: | | if you see i got nice entry of short @ 115.80 covered 50 % @ 115.20 now will reverse position when 6 min candle close above 116.20 |
Pl check my HDIL chart & let me know what wrong am I doing as I'm unable to get proper signal as per set up told by you...tks !
MAYBE in my ODIN, RED is for SELL and GREEN is for BUY......is it ?

Last edited by Amitsh27 on Fri Jan 04, 2013 11:44 am; edited 1 time in total |
|
| Back to top |
|
|
kamal.icharts
Site Admin
Joined: 10 Apr 2013
Posts: 576
|
|
| Back to top |
|
|
Amitsh27
White Belt
Joined: 20 Dec 2012
Posts: 47
|
| Post: #162 Posted: Fri Jan 04, 2013 12:25 pm Post subject: |
|
|
dear Intra trader,
your reply on my yesterday's query is awaited. pl note, I uploaded today's chart but query is same.
Also,let me know if I can use ST for playing OPTIONS as well ? (lack of fund sometimes )
Thnx buddy !
Amit
|
|
| Back to top |
|
|
intra.trader
White Belt
Joined: 25 Sep 2012
Posts: 402
|
| Post: #163 Posted: Tue Jan 08, 2013 1:07 pm Post subject: |
|
|
| Amitsh27 wrote: | | intra.trader wrote: | | if you see i got nice entry of short @ 115.80 covered 50 % @ 115.20 now will reverse position when 6 min candle close above 116.20 |
Pl check my HDIL chart & let me know what wrong am I doing as I'm unable to get proper signal as per set up told by you...tks !
MAYBE in my ODIN, RED is for SELL and GREEN is for BUY......is it ?
|
When candle pierced the green line and close below that , color changed to red, that is a sell signal
|
|
| Back to top |
|
|
Amitsh27
White Belt
Joined: 20 Dec 2012
Posts: 47
|
| Post: #164 Posted: Tue Jan 08, 2013 7:36 pm Post subject: |
|
|
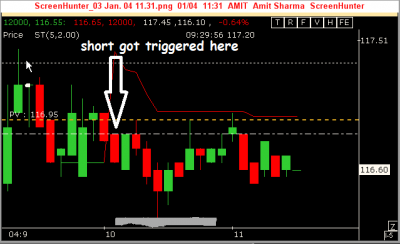
Hi IT,
R u talking about 8th candle??
Rgds
Amit
|
|
| Back to top |
|
|
intra.trader
White Belt
Joined: 25 Sep 2012
Posts: 402
|
| Post: #165 Posted: Wed Jan 09, 2013 9:52 am Post subject: |
|
|
| Amitsh27 wrote: | Hi IT,
R u talking about 8th candle??
Rgds
Amit |
| Description: |
|
| Filesize: |
14.96 KB |
| Viewed: |
543 Time(s) |
|
|
|
| Back to top |
|
|
|