| View previous topic :: View next topic |
| Author |
SVKum's BB10 strategy |
sumesh_sol
Brown Belt

Joined: 06 Jun 2010
Posts: 2344
|
Post: #16  Posted: Fri Jan 13, 2012 10:39 pm Post subject: IDEA Posted: Fri Jan 13, 2012 10:39 pm Post subject: IDEA |
 |
|
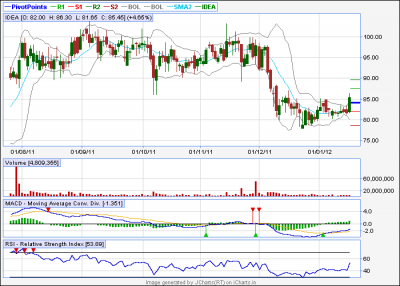
IDEA..eod chart
===========
As per my discussion in SB with seniors (mayur sir/svkum sir/rvg sir), I came to know that bb10 method can be applied on daily charts also with the same settings and method of entry/exit.
Here, I'm attaching one chart of IDEA on eod. It has breached upper bb after consolidating for about one month between 80-85 levels. MACD is also in healthy positive zone. I plan to enter above today's high. If it breaks 87.1 which is last swing high, I suppose it can give good move upto 100.
I request seniors to comment on this and suggest any modification if required.
Regards,
Sumesh
| Description: |
|
| Filesize: |
27.18 KB |
| Viewed: |
856 Time(s) |
|
|
|
| Back to top |
|
 |
|
|
|
prabit
White Belt

Joined: 02 Jul 2009
Posts: 133
|
| Post: #17 Posted: Sat Jan 14, 2012 10:18 am Post subject: |
|
|
| A big thank for Svkum and Santosh for this wonderful strategy. I like the strategy because it avoids sideways move. Actually here entry is at the end of sideways move. Most strategies fail during sideways.
|
|
| Back to top |
|
|
girishhu1
White Belt
Joined: 17 Aug 2009
Posts: 316
|
| Post: #18 Posted: Sat Jan 14, 2012 11:06 am Post subject: |
|
|
hi,
thanks to svkum for this strategy.
on entering a trade with this strategy, watch for a reversal candle ie doji or hammer etc if reversal candle is observed , with confirmation of momentum oscillators, we can take reverse trade also with a target of opposite bb. seniors may pl comment.
regards,
girish
|
|
| Back to top |
|
|
rvg
White Belt
Joined: 31 Oct 2006
Posts: 279
|
| Post: #19 Posted: Mon Jan 16, 2012 2:49 pm Post subject: Re: IDEA |
|
|
| sumesh_sol wrote: | IDEA..eod chart
===========
|
sumesh.. if you see idea closely, eod candle of 12 Jan has breached BBTop and candle of 13Jan is a buy above 12/Jan high .. Major momentum has already been achived with 13/Jan Candle..
You may also want to plot ATR(14) or ATR(22) along with other indicators to give you an idea of price contraction.
|
|
| Back to top |
|
|
sumesh_sol
Brown Belt
Joined: 06 Jun 2010
Posts: 2344
|
| Post: #20 Posted: Mon Jan 16, 2012 2:54 pm Post subject: Re: IDEA |
|
|
| rvg wrote: | | sumesh_sol wrote: | IDEA..eod chart
===========
|
sumesh.. if you see idea closely, eod candle of 12 Jan has breached BBTop and candle of 13Jan is a buy above 12/Jan high .. Major momentum has already been achived with 13/Jan Candle..
You may also want to plot ATR(14) or ATR(22) along with other indicators to give you an idea of price contraction. |
Thank you rvg for your reply.. I plotted ATR, but don;t know how exactly to interpret it.. can u please throw some light on this whenever u r free..
Regards,
Sumesh
|
|
| Back to top |
|
|
rvg
White Belt
Joined: 31 Oct 2006
Posts: 279
|
| Post: #21 Posted: Mon Jan 16, 2012 3:02 pm Post subject: Re: IDEA |
|
|
| sumesh_sol wrote: |
Thank you rvg for your reply.. I plotted ATR, but don;t know how exactly to interpret it.. can u please throw some light on this whenever u r free..
Regards,
Sumesh |
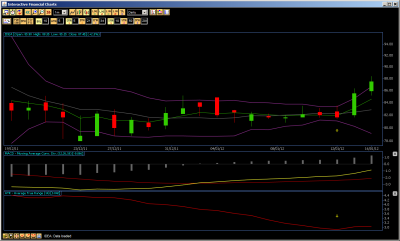
You can go thru Investopedia or other sites for information on ATR.. when ATR is at it's lowest, price movements can happen.
I have attached a chart which is self explanatory.
| Description: |
|
| Filesize: |
64.35 KB |
| Viewed: |
692 Time(s) |
|
|
|
| Back to top |
|
|
sumesh_sol
Brown Belt
Joined: 06 Jun 2010
Posts: 2344
|
| Post: #22 Posted: Mon Jan 16, 2012 7:01 pm Post subject: Emami |
|
|
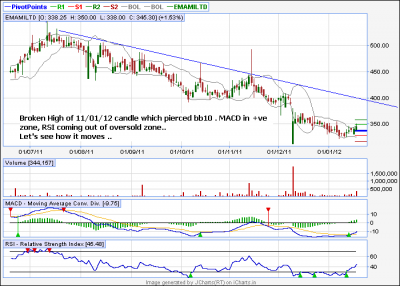
Emami...(EOD )
==========
| Description: |
|
| Filesize: |
27.59 KB |
| Viewed: |
712 Time(s) |
|
|
|
| Back to top |
|
|
sumesh_sol
Brown Belt
Joined: 06 Jun 2010
Posts: 2344
|
| Post: #23 Posted: Fri Jan 20, 2012 1:02 pm Post subject: BHEL |
|
|
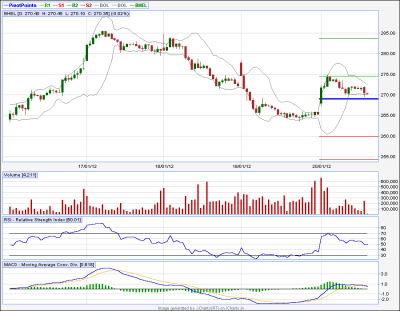
BHEL..(for intra..)
=============
Short entry below 269.5 possible..
| Description: |
|
| Filesize: |
17.23 KB |
| Viewed: |
668 Time(s) |
|
|
|
| Back to top |
|
|
sumesh_sol
Brown Belt
Joined: 06 Jun 2010
Posts: 2344
|
| Post: #24 Posted: Tue Jan 24, 2012 8:50 pm Post subject: RUCHISOYA |
|
|
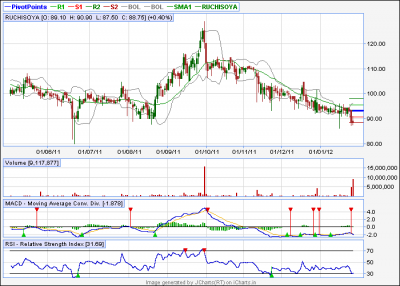
RUCHISOYA..eod
============
Can we see 80 below 87 mark ??
| Description: |
|
| Filesize: |
28.78 KB |
| Viewed: |
582 Time(s) |
|
|
|
| Back to top |
|
|
sumesh_sol
Brown Belt
Joined: 06 Jun 2010
Posts: 2344
|
| Post: #25 Posted: Tue Jan 24, 2012 10:01 pm Post subject: MRPL.. |
|
|
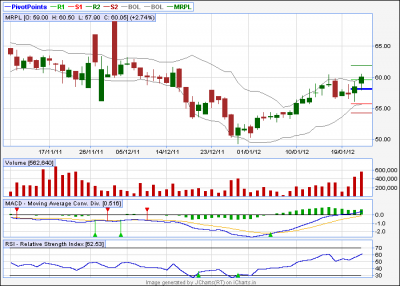
MRPL..eod
========
bb10 BO above 60.5 for target of 67 & 70 ..!!
| Description: |
|
| Filesize: |
25.22 KB |
| Viewed: |
577 Time(s) |
|
|
|
| Back to top |
|
|
bolband_macd
White Belt
Joined: 06 Sep 2011
Posts: 104
|
| Post: #26 Posted: Wed Jan 25, 2012 4:08 pm Post subject: SBIN Feb Futures on BB(10) |
|
|
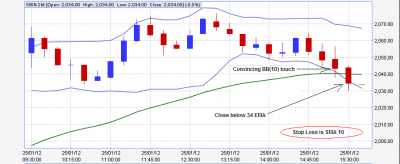
Friends,
Have a good look at this attractive looking bb(10) 15tf short trade. Clean touch and follow up with bb(10 lower band.
Additionally, close below 34 ema is an extra salt and spice.
However, a good idea is to wait for first candle close on friday.
Lets sit back, relax and watch the fun unleashed!
Trade Safe,
BM
| Description: |
|
| Filesize: |
30.87 KB |
| Viewed: |
697 Time(s) |
|
|
|
| Back to top |
|
|
sumesh_sol
Brown Belt
Joined: 06 Jun 2010
Posts: 2344
|
| Post: #27 Posted: Sun Jan 29, 2012 12:27 am Post subject: FORTIS |
|
|
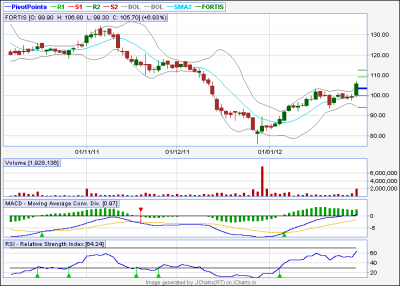
FORTIS...eod
=========
This looks like an excellent case of volatality breakout on eod chart... Should move upto 113/117 in very short term..
| Description: |
|
| Filesize: |
22.47 KB |
| Viewed: |
547 Time(s) |
|
|
|
| Back to top |
|
|
sumesh_sol
Brown Belt
Joined: 06 Jun 2010
Posts: 2344
|
|
| Back to top |
|
|
sumesh_sol
Brown Belt
Joined: 06 Jun 2010
Posts: 2344
|
| Post: #29 Posted: Mon Jan 30, 2012 3:46 pm Post subject: Re: JAIBALAJI |
|
|
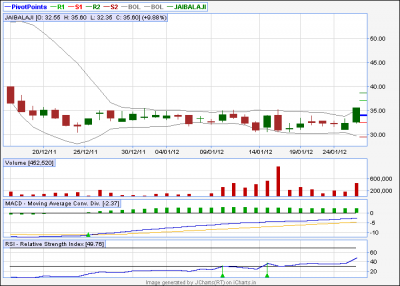
| sumesh_sol wrote: | JAIBALAJI...eod
==========
It would be really interesting to watch out this scrip in coming days... It has broken out of range after a prolonged consolidation... and as per my limited knowledge, it can either lead to a head fake or a very good uprise...  |
An upper freeze on this turbulent day ....
|
|
| Back to top |
|
|
sumesh_sol
Brown Belt
Joined: 06 Jun 2010
Posts: 2344
|
| Post: #30 Posted: Mon Jan 30, 2012 3:56 pm Post subject: A VERY GOOD USE OF BB10.. |
|
|
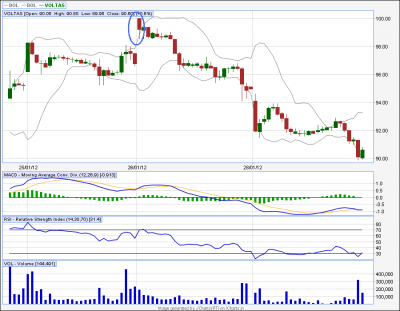
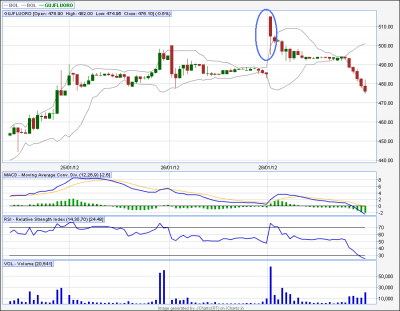
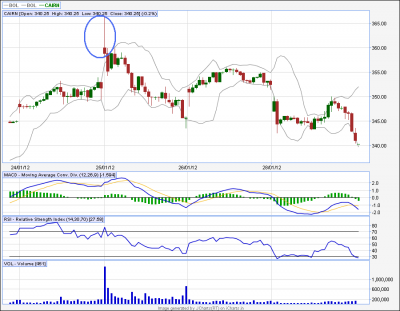
Dear Friends,
Few days back I read it in some site, that if a stock opens up much high than upper band of bb, and closes the first candle in red (may be inverted hammer type) out of band, then there is a very strong possibility of it to touch it mid of band and lower band.
So this can be used to initiate short trade . We can use logical SL in this case.. Please see 3 different trades I took during past couple of days... They all hit target of lower band( and in fact much below after that )
The problem is how to find such setup, so what I do is I try to find top 5 nifty/Jr. nifty stocks in the first 15 mnts. and if any of them fullfils this condition I take trade..
Suggetions are welcome..
Regards,
Sumesh
| Description: |
|
| Filesize: |
48.74 KB |
| Viewed: |
589 Time(s) |
|
| Description: |
|
| Filesize: |
47.3 KB |
| Viewed: |
523 Time(s) |
|
| Description: |
|
| Filesize: |
53.68 KB |
| Viewed: |
544 Time(s) |
|
|
|
| Back to top |
|
|
|