| View previous topic :: View next topic |
| Author |
Swing trade--perfect EMA crossover |
will_recover
White Belt

Joined: 19 Aug 2010
Posts: 55
|
Post: #16  Posted: Fri Sep 03, 2010 10:46 am Post subject: Posted: Fri Sep 03, 2010 10:46 am Post subject: |
 |
|
| chrome wrote: | | girishhu1 wrote: | CHROME wrote:
''As per trade strategy:
Reliance seems buy till 935 close candle on 5 min charts.
Suzlon sell near 46.50 signal already on chart now.
NS till 5475 candle close looks good for long.
Bank nifty spot till 10940 candle close looks good for long."
''
Do u mean that long position in reliance should be squared off for a 5 min candle close below 935?
regards |
exactly...close below 935 on a 5 minute candle chart means close the long position and initiate short simultaneously...chart also attached for refference. |
I GUES THE TRADE IS ACTIVATED TO SELL RIL..AND NOW WHAT SHOULD BE SL FOR THE SHORT
|
|
| Back to top |
|
 |
|
|
 |
chrome
Yellow Belt

Joined: 28 Dec 2009
Posts: 645
|
Post: #17  Posted: Fri Sep 03, 2010 10:59 am Post subject: Posted: Fri Sep 03, 2010 10:59 am Post subject: |
 |
|
| will_recover wrote: | | chrome wrote: | | girishhu1 wrote: | CHROME wrote:
''As per trade strategy:
Reliance seems buy till 935 close candle on 5 min charts.
Suzlon sell near 46.50 signal already on chart now.
NS till 5475 candle close looks good for long.
Bank nifty spot till 10940 candle close looks good for long."
''
Do u mean that long position in reliance should be squared off for a 5 min candle close below 935?
regards |
exactly...close below 935 on a 5 minute candle chart means close the long position and initiate short simultaneously...chart also attached for refference. |
I GUES THE TRADE IS ACTIVATED TO SELL RIL..AND NOW WHAT SHOULD BE SL FOR THE SHORT |
SL as per base strategy can be one of the below as per one's trading capacity :
1.) 5 minute candle close above 200 EMA (for shorts)
2.) crossover of 107 EMA & 200 EMA again.
|
|
| Back to top |
|
 |
chrome
Yellow Belt

Joined: 28 Dec 2009
Posts: 645
|
Post: #18  Posted: Thu Sep 09, 2010 10:34 am Post subject: Posted: Thu Sep 09, 2010 10:34 am Post subject: |
 |
|
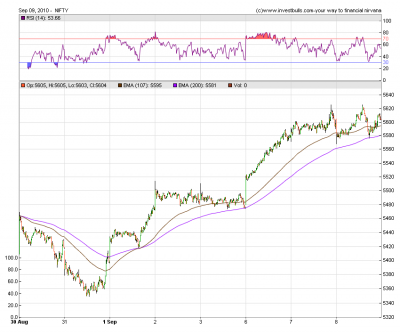
Update : Nifty Spot gave buy signal on 1st Sept near 5430 and is still holding the long setup..no EMA reverse crossover, no 200 EMA price crossover for exiting !!! Cool 200 points upmove !!!
| Description: |
|
| Filesize: |
47.96 KB |
| Viewed: |
587 Time(s) |
|
|
|
| Back to top |
|
 |
maooliservice
White Belt

Joined: 04 Aug 2010
Posts: 93
|
Post: #19  Posted: Thu Sep 09, 2010 12:24 pm Post subject: Posted: Thu Sep 09, 2010 12:24 pm Post subject: |
 |
|
hi chrome
I am new to TA.can u explain me how to use this set up for stocks
|
|
| Back to top |
|
 |
chrome
Yellow Belt

Joined: 28 Dec 2009
Posts: 645
|
Post: #20  Posted: Thu Sep 09, 2010 1:17 pm Post subject: Posted: Thu Sep 09, 2010 1:17 pm Post subject: |
 |
|
| maooliservice wrote: | hi chrome
I am new to TA.can u explain me how to use this set up for stocks |
Hi, pls go through this thread from starting..everything is mentioned there regarding this set-up...
|
|
| Back to top |
|
 |
chetan83
Brown Belt

Joined: 19 Feb 2010
Posts: 2037
|
Post: #21  Posted: Thu Sep 09, 2010 3:28 pm Post subject: EMA CROSSOVER Posted: Thu Sep 09, 2010 3:28 pm Post subject: EMA CROSSOVER |
 |
|
D/Crome,
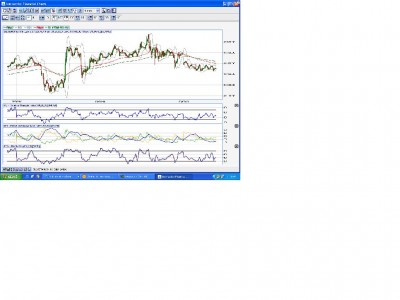
The mentioned set-up does not hold true for Silver in the 5mins charts. Pls guide on this, as Buy was initiated at 31510 and sell at 31375. Pls guide if I am wrong.
| Description: |
|
| Filesize: |
79.04 KB |
| Viewed: |
548 Time(s) |
|
|
|
| Back to top |
|
 |
chrome
Yellow Belt

Joined: 28 Dec 2009
Posts: 645
|
Post: #22  Posted: Thu Sep 09, 2010 3:46 pm Post subject: Re: EMA CROSSOVER Posted: Thu Sep 09, 2010 3:46 pm Post subject: Re: EMA CROSSOVER |
 |
|
| chetan83 wrote: | D/Crome,
The mentioned set-up does not hold true for Silver in the 5mins charts. Pls guide on this, as Buy was initiated at 31510 and sell at 31375. Pls guide if I am wrong. |
Hi Chetan,
havn't checked this strategy in commodities yet, so not sure for this set-up in commodities...pls validate by some other charts with gold, crude, NG etc if u can...kindly post some of these charts here if u can
|
|
| Back to top |
|
 |
girishhu1
White Belt

Joined: 17 Aug 2009
Posts: 316
|
Post: #23  Posted: Fri Sep 10, 2010 9:27 am Post subject: Posted: Fri Sep 10, 2010 9:27 am Post subject: |
 |
|
hello chrome,
what is the difference between your and speculator's swing trading? speculator is using 15 m tf ,34 ema xover and rsi(5).Is the 5 m tf more suitable for intraday trading?
|
|
| Back to top |
|
 |
chrome
Yellow Belt

Joined: 28 Dec 2009
Posts: 645
|
Post: #24  Posted: Fri Sep 10, 2010 10:32 am Post subject: Posted: Fri Sep 10, 2010 10:32 am Post subject: |
 |
|
| girishhu1 wrote: | hello chrome,
what is the difference between your and speculator's swing trading? speculator is using 15 m tf ,34 ema xover and rsi(5).Is the 5 m tf more suitable for intraday trading? |
Hi Girish,
cant say about difference but I have posted here a simple technique of EMA crossover of 107/200 on 5 min charts...I have got good results in 5 min timeframe but one can chose to test the setup in othertime frames too...EOD I have already covered in the starting of this thread...
pls note , no setup is perfect and no setup is a writting on the wall !! One can modify other's set-up's too 
|
|
| Back to top |
|
 |
jjm
White Belt

Joined: 17 Mar 2010
Posts: 411
|
|
| Back to top |
|
 |
jjm
White Belt

Joined: 17 Mar 2010
Posts: 411
|
Post: #26  Posted: Fri Sep 10, 2010 2:32 pm Post subject: STOCK GIVEN BO/BD IN LAST 2 DAYS Posted: Fri Sep 10, 2010 2:32 pm Post subject: STOCK GIVEN BO/BD IN LAST 2 DAYS |
 |
|
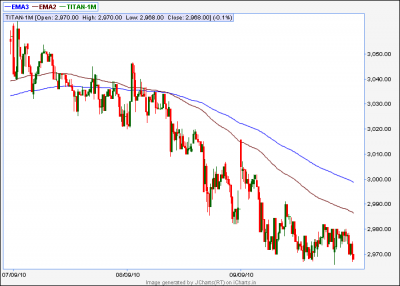
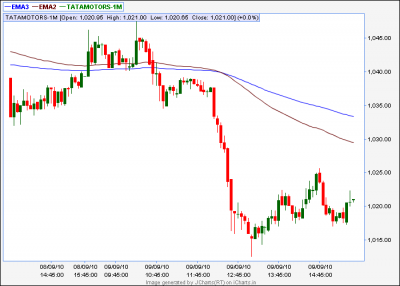
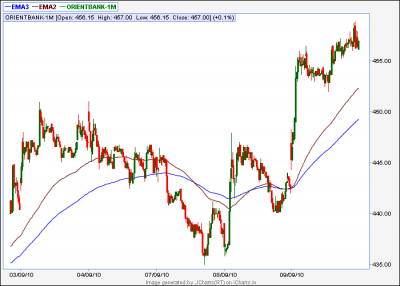
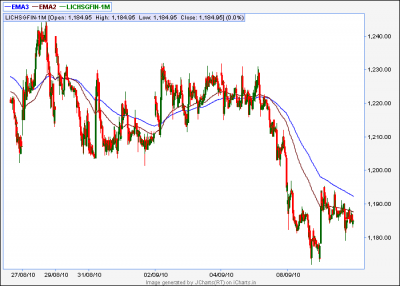
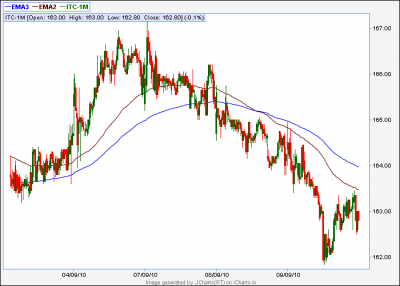
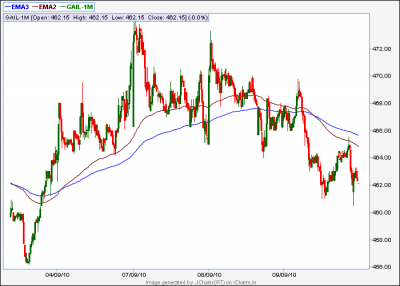
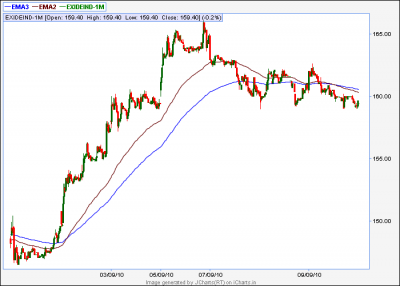
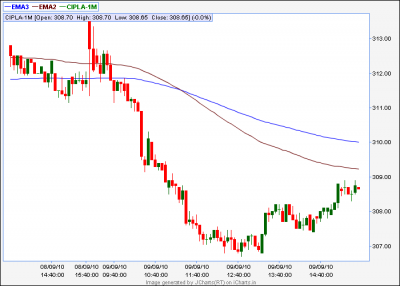
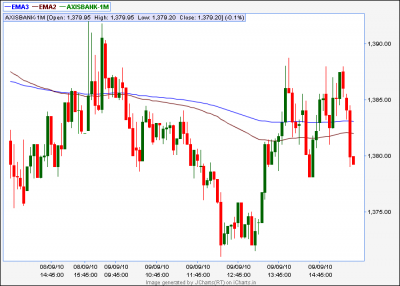
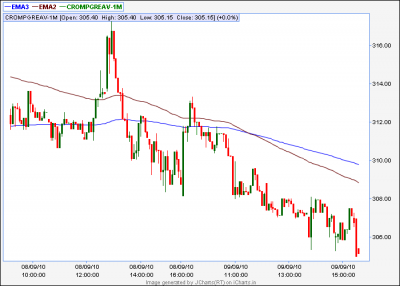
Dear all,
A list of stocks from my watch list given BO as well as BD in last 2 days

JJM
| Description: |
|
| Filesize: |
19.42 KB |
| Viewed: |
509 Time(s) |
|
| Description: |
|
| Filesize: |
18.02 KB |
| Viewed: |
482 Time(s) |
|
| Description: |
|
| Filesize: |
21.9 KB |
| Viewed: |
477 Time(s) |
|
| Description: |
|
| Filesize: |
25.33 KB |
| Viewed: |
486 Time(s) |
|
| Description: |
|
| Filesize: |
20.75 KB |
| Viewed: |
470 Time(s) |
|
| Description: |
|
| Filesize: |
21.81 KB |
| Viewed: |
436 Time(s) |
|
| Description: |
|
| Filesize: |
19.46 KB |
| Viewed: |
457 Time(s) |
|
| Description: |
|
| Filesize: |
17.21 KB |
| Viewed: |
453 Time(s) |
|
| Description: |
|
| Filesize: |
19.17 KB |
| Viewed: |
466 Time(s) |
|
| Description: |
|
| Filesize: |
17.72 KB |
| Viewed: |
462 Time(s) |
|
|
|
| Back to top |
|
 |
jjm
White Belt

Joined: 17 Mar 2010
Posts: 411
|
Post: #27  Posted: Fri Sep 10, 2010 2:34 pm Post subject: Posted: Fri Sep 10, 2010 2:34 pm Post subject: |
 |
|
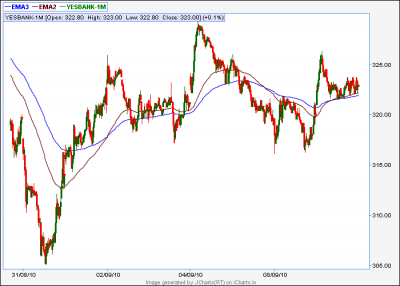
Last one
| Description: |
|
| Filesize: |
22.78 KB |
| Viewed: |
472 Time(s) |
|
|
|
| Back to top |
|
 |
girishhu1
White Belt

Joined: 17 Aug 2009
Posts: 316
|
Post: #28  Posted: Fri Sep 10, 2010 7:56 pm Post subject: Posted: Fri Sep 10, 2010 7:56 pm Post subject: |
 |
|
hi chrome ,
spec used to say, 13 ema is bread & butter of a trader. any rejection from 13 ema should be used to take entry.is there any such ema in your strategy?
regards
|
|
| Back to top |
|
 |
chrome
Yellow Belt

Joined: 28 Dec 2009
Posts: 645
|
Post: #29  Posted: Fri Sep 10, 2010 9:14 pm Post subject: Posted: Fri Sep 10, 2010 9:14 pm Post subject: |
 |
|
| girishhu1 wrote: | hi chrome ,
spec used to say, 13 ema is bread & butter of a trader. any rejection from 13 ema should be used to take entry.is there any such ema in your strategy?
regards |
hi girish,
no such other ema strategy in 107-200 crossover trade..one gud suggestion posted below by jjm is to initiate the trade near ema level price....
also advisable to trade index based large cap stocks or the indices..more profitable these are..
|
|
| Back to top |
|
 |
chrome
Yellow Belt

Joined: 28 Dec 2009
Posts: 645
|
|
| Back to top |
|
 |
|

