| View previous topic :: View next topic |
| Author |
Swing trade--perfect EMA crossover |
chrome
Yellow Belt

Joined: 28 Dec 2009
Posts: 645
|
Post: #1  Posted: Thu Sep 02, 2010 12:06 am Post subject: Swing trade--perfect EMA crossover Posted: Thu Sep 02, 2010 12:06 am Post subject: Swing trade--perfect EMA crossover |
 |
|
Hi frndz,
i'll be posting an important EMA crossover trade strategy in this forum starting 2mmrw onwards with charts....hope one could gain from this 
|
|
| Back to top |
|
 |
|
|
 |
newinvestor
White Belt

Joined: 16 Feb 2010
Posts: 120
|
Post: #2  Posted: Thu Sep 02, 2010 12:30 am Post subject: Re: Swing trade--perfect EMA crossover Posted: Thu Sep 02, 2010 12:30 am Post subject: Re: Swing trade--perfect EMA crossover |
 |
|
| chrome wrote: | Hi frndz,
i'll be posting an important EMA crossover trade strategy in this forum starting 2mmrw onwards with charts....hope one could gain from this  |
That will be helpful . Look forward to it
|
|
| Back to top |
|
 |
chrome
Yellow Belt

Joined: 28 Dec 2009
Posts: 645
|
Post: #3  Posted: Thu Sep 02, 2010 2:07 pm Post subject: The Strategy Posted: Thu Sep 02, 2010 2:07 pm Post subject: The Strategy |
 |
|
Hi All
Continuing the thread...
The strategy is for swing trades only where one may have to carry the position ranging from 1 day to 7 days.
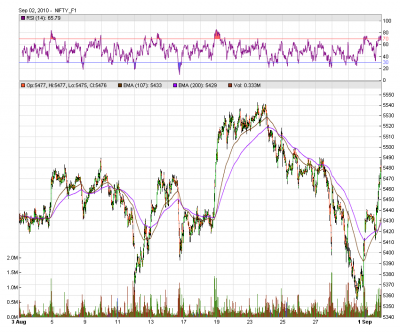
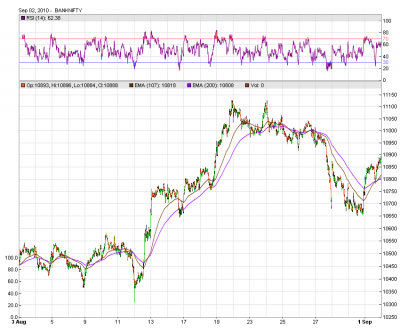
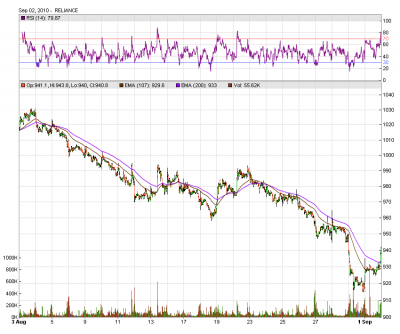
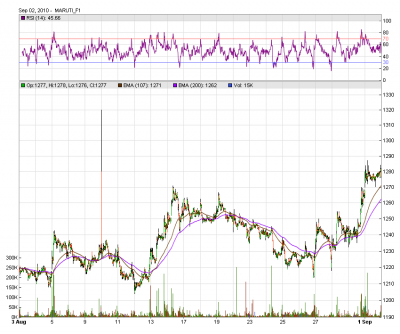
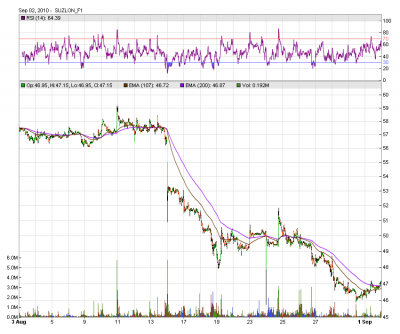
The EMA crossover of 107 & 200 on 5 minutes Chart is the base setup. As and when EMA 107 crosses 200 EMA comprehensively from bottom to upside on 5 minute chart, the Long trade need to be initiated. One can close the trade when EMA 107 crosses from 200 EMA from upside to the bottom side and can initiate short position immediately.
The SL for the trade can put when a complete candle closes below 200 EMA for longs or one can wait for 107 EMA reversal crossover also as SL.
For initiating shorts, the vice versa strategy applies.
Attached below are some charts of NF, Bank Nifty, Reliance, Maruti, Suzlon for refference. (5 minute candle charts for 1 month).
Comments from the fellow readers are most  . .
| Description: |
|
| Filesize: |
90.1 KB |
| Viewed: |
1167 Time(s) |
|
| Description: |
|
| Filesize: |
74.16 KB |
| Viewed: |
641 Time(s) |
|
| Description: |
|
| Filesize: |
72.85 KB |
| Viewed: |
603 Time(s) |
|
| Description: |
|
| Filesize: |
77.33 KB |
| Viewed: |
601 Time(s) |
|
| Description: |
|
| Filesize: |
74.78 KB |
| Viewed: |
584 Time(s) |
|
|
|
| Back to top |
|
 |
sherbaaz
Yellow Belt

Joined: 27 May 2009
Posts: 543
|
Post: #4  Posted: Thu Sep 02, 2010 2:26 pm Post subject: Re: The Strategy Posted: Thu Sep 02, 2010 2:26 pm Post subject: Re: The Strategy |
 |
|
| chrome wrote: | Hi All
Continuing the thread...
The strategy is for swing trades only where one may have to carry the position ranging from 1 day to 7 days.
The EMA crossover of 107 & 200 on 5 minutes Chart is the base setup. As and when EMA 107 crosses 200 EMA comprehensively from bottom to upside on 5 minute chart, the Long trade need to be initiated. One can close the trade when EMA 107 crosses from 200 EMA from upside to the bottom side and can initiate short position immediately.
The SL for the trade can put when a complete candle closes below 200 EMA for longs or one can wait for 107 EMA reversal crossover also as SL.
For initiating shorts, the vice versa strategy applies.
Attached below are some charts of NF, Bank Nifty, Reliance, Maruti, Suzlon for refference. (5 minute candle charts for 1 month).
Comments from the fellow readers are most  . . |
Hi Chrome,
Your EMA selection looks very interesting. Is the same combination works on eod charts?
Regards,

|
|
| Back to top |
|
 |
will_recover
White Belt

Joined: 19 Aug 2010
Posts: 55
|
Post: #5  Posted: Thu Sep 02, 2010 2:40 pm Post subject: Posted: Thu Sep 02, 2010 2:40 pm Post subject: |
 |
|
| ps advise your trade sugg for nifty/banknifty/reliance/suzlon based on the charts submitted
|
|
| Back to top |
|
 |
chrome
Yellow Belt

Joined: 28 Dec 2009
Posts: 645
|
Post: #6  Posted: Thu Sep 02, 2010 2:49 pm Post subject: Re: The Strategy Posted: Thu Sep 02, 2010 2:49 pm Post subject: Re: The Strategy |
 |
|
| sherbaaz wrote: | | chrome wrote: | Hi All
Continuing the thread...
The strategy is for swing trades only where one may have to carry the position ranging from 1 day to 7 days.
The EMA crossover of 107 & 200 on 5 minutes Chart is the base setup. As and when EMA 107 crosses 200 EMA comprehensively from bottom to upside on 5 minute chart, the Long trade need to be initiated. One can close the trade when EMA 107 crosses from 200 EMA from upside to the bottom side and can initiate short position immediately.
The SL for the trade can put when a complete candle closes below 200 EMA for longs or one can wait for 107 EMA reversal crossover also as SL.
For initiating shorts, the vice versa strategy applies.
Attached below are some charts of NF, Bank Nifty, Reliance, Maruti, Suzlon for refference. (5 minute candle charts for 1 month).
Comments from the fellow readers are most  . . |
Hi Chrome,
Your EMA selection looks very interesting. Is the same combination works on eod charts?
Regards,
 |
Hi Sherbaaz,
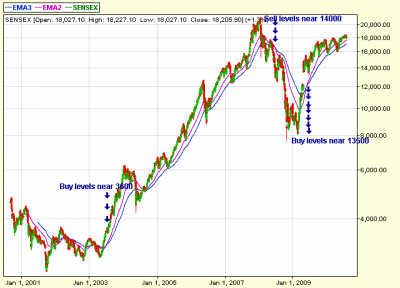
EMA crossover of 107 and 200 on EOD charts will be found very rarely... Attached Sensex 10 years charts shows only 3 chances to trade as per this setup:
1.) 1st Buy near 3600 sensex levels in year 2003.
2.) Sell near 14000 sensex levels in year 2008.
3.) Buy near 13500 sensex levels in year 2009.
This crossover stands true for EOD charts too but one should consider it for Investment purpose only based on EOD charts.
| Description: |
|
| Filesize: |
15.01 KB |
| Viewed: |
680 Time(s) |
|
|
|
| Back to top |
|
 |
chrome
Yellow Belt

Joined: 28 Dec 2009
Posts: 645
|
Post: #7  Posted: Thu Sep 02, 2010 2:55 pm Post subject: Posted: Thu Sep 02, 2010 2:55 pm Post subject: |
 |
|
| will_recover wrote: | | ps advise your trade sugg for nifty/banknifty/reliance/suzlon based on the charts submitted |
As per trade strategy:
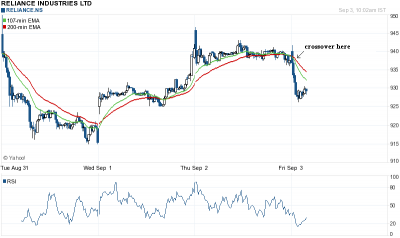
Reliance seems buy till 935 close candle on 5 min charts.
Suzlon sell near 46.50 signal already on chart now.
NS till 5475 candle close looks good for long.
Bank nifty spot till 10940 candle close looks good for long.
|
|
| Back to top |
|
 |
will_recover
White Belt

Joined: 19 Aug 2010
Posts: 55
|
Post: #8  Posted: Thu Sep 02, 2010 3:11 pm Post subject: Re: The Strategy Posted: Thu Sep 02, 2010 3:11 pm Post subject: Re: The Strategy |
 |
|
so whats the advice for sensex
| chrome wrote: | | sherbaaz wrote: | | chrome wrote: | Hi All
Continuing the thread...
The strategy is for swing trades only where one may have to carry the position ranging from 1 day to 7 days.
The EMA crossover of 107 & 200 on 5 minutes Chart is the base setup. As and when EMA 107 crosses 200 EMA comprehensively from bottom to upside on 5 minute chart, the Long trade need to be initiated. One can close the trade when EMA 107 crosses from 200 EMA from upside to the bottom side and can initiate short position immediately.
The SL for the trade can put when a complete candle closes below 200 EMA for longs or one can wait for 107 EMA reversal crossover also as SL.
For initiating shorts, the vice versa strategy applies.
Attached below are some charts of NF, Bank Nifty, Reliance, Maruti, Suzlon for refference. (5 minute candle charts for 1 month).
Comments from the fellow readers are most  . . |
Hi Chrome,
Your EMA selection looks very interesting. Is the same combination works on eod charts?
Regards,
 |
Hi Sherbaaz,
EMA crossover of 107 and 200 on EOD charts will be found very rarely... Attached Sensex 10 years charts shows only 3 chances to trade as per this setup:
1.) 1st Buy near 3600 sensex levels in year 2003.
2.) Sell near 14000 sensex levels in year 2008.
3.) Buy near 13500 sensex levels in year 2009.
This crossover stands true for EOD charts too but one should consider it for Investment purpose only based on EOD charts. |
|
|
| Back to top |
|
 |
will_recover
White Belt

Joined: 19 Aug 2010
Posts: 55
|
Post: #9  Posted: Thu Sep 02, 2010 3:14 pm Post subject: Posted: Thu Sep 02, 2010 3:14 pm Post subject: |
 |
|
whats sl in suzlon
| chrome wrote: | | will_recover wrote: | | ps advise your trade sugg for nifty/banknifty/reliance/suzlon based on the charts submitted |
As per trade strategy:
Reliance seems buy till 935 close candle on 5 min charts.
Suzlon sell near 46.50 signal already on chart now.
NS till 5475 candle close looks good for long.
Bank nifty spot till 10940 candle close looks good for long. |
|
|
| Back to top |
|
 |
chrome
Yellow Belt

Joined: 28 Dec 2009
Posts: 645
|
Post: #10  Posted: Thu Sep 02, 2010 3:24 pm Post subject: Posted: Thu Sep 02, 2010 3:24 pm Post subject: |
 |
|
| will_recover wrote: | whats sl in suzlon
| chrome wrote: | | will_recover wrote: | | ps advise your trade sugg for nifty/banknifty/reliance/suzlon based on the charts submitted |
As per trade strategy:
Reliance seems buy till 935 close candle on 5 min charts.
Suzlon sell near 46.50 signal already on chart now.
NS till 5475 candle close looks good for long.
Bank nifty spot till 10940 candle close looks good for long. |
|
Big short covering in Suzlon in couple of minutes only !!!! As mentioned in 1st post, now EMA 107 crossed from below above 200 EMA near 47/47.50 in a single candle only so one need to close the short trade and initiate a new long trade immediately.
Just heard Reliance going for stake in Suzlon....not 100% sure of the news though
Last edited by chrome on Thu Sep 02, 2010 3:30 pm; edited 1 time in total |
|
| Back to top |
|
 |
will_recover
White Belt

Joined: 19 Aug 2010
Posts: 55
|
Post: #11  Posted: Thu Sep 02, 2010 3:30 pm Post subject: Posted: Thu Sep 02, 2010 3:30 pm Post subject: |
 |
|
done but got jammed...pls advise sl for long trade in suzy now
| chrome wrote: | | will_recover wrote: | whats sl in suzlon
| chrome wrote: | | will_recover wrote: | | ps advise your trade sugg for nifty/banknifty/reliance/suzlon based on the charts submitted |
As per trade strategy:
Reliance seems buy till 935 close candle on 5 min charts.
Suzlon sell near 46.50 signal already on chart now.
NS till 5475 candle close looks good for long.
Bank nifty spot till 10940 candle close looks good for long. |
|
Big short covering in Suzlon in couple of minutes only !!!! As mentioned in 1st post, now EMA 107 crossed from below above 200 EMA near 47/47.50 in a single candle only so one need to close the short trade and initiate a new long trade immediately. |
|
|
| Back to top |
|
 |
chrome
Yellow Belt

Joined: 28 Dec 2009
Posts: 645
|
Post: #12  Posted: Thu Sep 02, 2010 3:33 pm Post subject: Posted: Thu Sep 02, 2010 3:33 pm Post subject: |
 |
|
| will_recover wrote: | done but got jammed...pls advise sl for long trade in suzy now
| chrome wrote: | | will_recover wrote: | whats sl in suzlon
| chrome wrote: | | will_recover wrote: | | ps advise your trade sugg for nifty/banknifty/reliance/suzlon based on the charts submitted |
As per trade strategy:
Reliance seems buy till 935 close candle on 5 min charts.
Suzlon sell near 46.50 signal already on chart now.
NS till 5475 candle close looks good for long.
Bank nifty spot till 10940 candle close looks good for long. |
|
Big short covering in Suzlon in couple of minutes only !!!! As mentioned in 1st post, now EMA 107 crossed from below above 200 EMA near 47/47.50 in a single candle only so one need to close the short trade and initiate a new long trade immediately. |
|
News based + huge short covering..SL u can set up near 47-48...i know its too far but it can swing heavily now.
|
|
| Back to top |
|
 |
maooliservice
White Belt

Joined: 04 Aug 2010
Posts: 93
|
Post: #13  Posted: Thu Sep 02, 2010 4:59 pm Post subject: stoploss Posted: Thu Sep 02, 2010 4:59 pm Post subject: stoploss |
 |
|
| How do u decided these stoplosses
|
|
| Back to top |
|
 |
girishhu1
White Belt

Joined: 17 Aug 2009
Posts: 316
|
Post: #14  Posted: Fri Sep 03, 2010 8:41 am Post subject: Posted: Fri Sep 03, 2010 8:41 am Post subject: |
 |
|
CHROME wrote:
''As per trade strategy:
Reliance seems buy till 935 close candle on 5 min charts.
Suzlon sell near 46.50 signal already on chart now.
NS till 5475 candle close looks good for long.
Bank nifty spot till 10940 candle close looks good for long."
''
Do u mean that long position in reliance should be squared off for a 5 min candle close below 935?
regards
|
|
| Back to top |
|
 |
chrome
Yellow Belt

Joined: 28 Dec 2009
Posts: 645
|
Post: #15  Posted: Fri Sep 03, 2010 10:21 am Post subject: Posted: Fri Sep 03, 2010 10:21 am Post subject: |
 |
|
| girishhu1 wrote: | CHROME wrote:
''As per trade strategy:
Reliance seems buy till 935 close candle on 5 min charts.
Suzlon sell near 46.50 signal already on chart now.
NS till 5475 candle close looks good for long.
Bank nifty spot till 10940 candle close looks good for long."
''
Do u mean that long position in reliance should be squared off for a 5 min candle close below 935?
regards |
exactly...close below 935 on a 5 minute candle chart means close the long position and initiate short simultaneously...chart also attached for refference.
| Description: |
|
| Filesize: |
16.17 KB |
| Viewed: |
594 Time(s) |
|
|
|
| Back to top |
|
 |
|

