|
|
| View previous topic :: View next topic |
| Author |
Swing Trading by Ichimoku Trading System |
rameshraja
Expert

Joined: 24 Nov 2006
Posts: 1121
|
Post: #16  Posted: Fri Feb 10, 2012 10:02 pm Post subject: Posted: Fri Feb 10, 2012 10:02 pm Post subject: |
 |
|
Mr Sachin
I have not downloaded Platinum Chart yet, and therefore I have no idea.
|
|
| Back to top |
|
 |
|
|  |
rameshraja
Expert

Joined: 24 Nov 2006
Posts: 1121
|
Post: #17  Posted: Fri Feb 10, 2012 11:36 pm Post subject: Posted: Fri Feb 10, 2012 11:36 pm Post subject: |
 |
|
Mr Vinay
Many times I have endedup in disaster in my trading and I don’t feel shy to admit this fact. None is born as professional trader. Initial stint of trading, my ignorance was colossal and when booked losses, I considered myself as paying fees for learning the trade and acquired the knowledge of what one should not do in trading.
Everyday I keep repeating the following sayings to myself, before I sit for trading.
“The market can stay irrational longer than you can stay solvent”
“ Market can humble anyone in the World “
Don’t take seriously the Title adorned to me as “Expert” in Forum, and I am still a student of technical analysis and willing to learn from you all by sharing my knowledge, which I gained in last 3 decades of trading.
|
|
| Back to top |
|
 |
traderindian
White Belt

Joined: 03 Apr 2010
Posts: 56
|
Post: #18  Posted: Sat Feb 11, 2012 1:49 am Post subject: Posted: Sat Feb 11, 2012 1:49 am Post subject: |
 |
|
Hello Ramesh sir, thanks a lot for your valuable inputs and a perfect explanation for all the doubts i had..Hats off to you sir.. 
|
|
| Back to top |
|
 |
rameshraja
Expert

Joined: 24 Nov 2006
Posts: 1121
|
Post: #19  Posted: Sat Feb 11, 2012 12:44 pm Post subject: Posted: Sat Feb 11, 2012 12:44 pm Post subject: |
 |
|
Hello Trader Indian
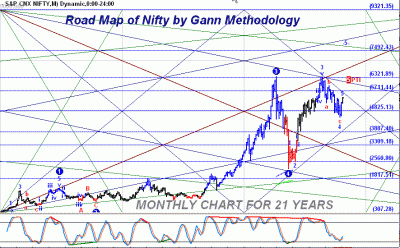
See the monthly chart of Nifty Spot in ichimoku, Fib & Gann.
Nifty went into corrective mode from 2008 peak of Bull market and retraced just above 0.786 of Fibonacci Retracement. In the process of correction, it touched the cloud and advanced again further.
Look at Gann Chart of 21 years. Nifty's correction just ended below 2 X 1 angle around 2250 in the year 2008.
Where Nifty right now placed ?
As per Gann methodology, if it closes above 5712 and when technical validation is completed, its headed to first target of 9320.
One finer point you will note, Nifty invariably bottomsout in monthly chart when stochastic oscillator (parameter 8 , 4, 3 ) gets into oversold and turns on upside. This you can notice in the Gann Chart.
Importantly, I observe many talk about Nifty's direction and targets without understanding its rhythemic move. Nifty as a broad market Index, doesn't break 3 months low so easily in an uptrend and if it does it, then market goes in for a big correction. In the same vein, when it crosses 3 months high after a substantial correction, then upmove is put in place. But aberration to 3 months breakout of high and low are minimal, which you can observe from charts.
Now lets combine all the tools and see if we could arrive at logical conclusion.
Nifty is trading above ichimoku cloud and has made breakout of 3 months high with Stochastics of 8,4,3 is turningup from oversold region. All these are perfectly set for upmove.. but catch here is, from Gann methodology. Unless Nifty closes above 5712, there cannot be any substantial upmove. As market has already overrun on upside without a breather, probably could face stiff resistance between 5475 - 5575 which is again Gann level of resistance.
Once when Nifty closes above 5712 with technical validation in place, then Good days are ahead with a substantial move to 9320.
I have tried to explain you the advantage of using multiple tools to arrive for trading decisions than simply relying on a standalone methodology.
Best Wishes
| Description: |
|
| Filesize: |
36.32 KB |
| Viewed: |
945 Time(s) |

|
| Description: |
|
| Filesize: |
31.3 KB |
| Viewed: |
1048 Time(s) |

|
|
|
| Back to top |
|
 |
saurabhkurichh
White Belt

Joined: 30 Oct 2006
Posts: 127
|
Post: #20  Posted: Sat Feb 11, 2012 5:59 pm Post subject: Posted: Sat Feb 11, 2012 5:59 pm Post subject: |
 |
|
| thanks sir . . . .
|
|
| Back to top |
|
 |
rameshraja
Expert

Joined: 24 Nov 2006
Posts: 1121
|
Post: #21  Posted: Sat Feb 11, 2012 6:04 pm Post subject: Posted: Sat Feb 11, 2012 6:04 pm Post subject: |
 |
|
Hi Saurab

|
|
| Back to top |
|
 |
saurabhkurichh
White Belt

Joined: 30 Oct 2006
Posts: 127
|
Post: #22  Posted: Sat Feb 11, 2012 7:16 pm Post subject: Posted: Sat Feb 11, 2012 7:16 pm Post subject: |
 |
|
| hello sir. . . long long time no see. . very nice to have you back
|
|
| Back to top |
|
 |
vinay28
Black Belt

Joined: 24 Dec 2010
Posts: 11748
|
Post: #23  Posted: Sat Feb 11, 2012 7:41 pm Post subject: Posted: Sat Feb 11, 2012 7:41 pm Post subject: |
 |
|
Yes rameshraja, but how many admit it is my concern and that's why I said Great. One more thing that you have said
......acquired the knowledge of what one should not do in trading
There are always two simplest and fastest and hence the best ways to learn in any walk of life (a) first is what, when, where, how and why NOT to do anything and (b) second is to learn from others' mistakes as well. And yet, that process goes on for the whole of our life.
May you reach further heights!
|
|
| Back to top |
|
 |
rk_a2003
Black Belt

Joined: 21 Jan 2010
Posts: 2734
|
Post: #24  Posted: Sat Feb 11, 2012 7:42 pm Post subject: Posted: Sat Feb 11, 2012 7:42 pm Post subject: |
 |
|
   Applause Mr. RR Applause Mr. RR
Ichimoku, Gann and Fib. It’s a Fantastic Fusion. It was said a scientific TA can reflect all the fundamental factors present at a given point of time (even without having a hint about it). In my opinion Your TA almost did it.
30 years of trading experience still no dearth of vigor?! And no hesitation to share. We are fortunate to have you in this forum with us. Thanks a lot.
|
|
| Back to top |
|
 |
rameshraja
Expert

Joined: 24 Nov 2006
Posts: 1121
|
Post: #25  Posted: Mon Feb 13, 2012 10:04 am Post subject: Posted: Mon Feb 13, 2012 10:04 am Post subject: |
 |
|
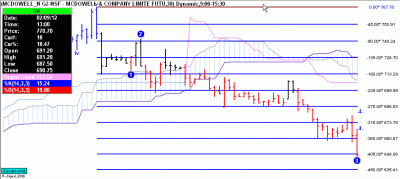
Mcdowell in Ichimoku with Gann Square of 9
| Description: |
|
| Filesize: |
21.56 KB |
| Viewed: |
661 Time(s) |

|
|
|
| Back to top |
|
 |
traderindian
White Belt

Joined: 03 Apr 2010
Posts: 56
|
Post: #26  Posted: Tue Feb 14, 2012 1:00 am Post subject: Posted: Tue Feb 14, 2012 1:00 am Post subject: |
 |
|
| rameshraja wrote: | Hello Trader Indian
See the monthly chart of Nifty Spot in ichimoku, Fib & Gann.
Nifty went into corrective mode from 2008 peak of Bull market and retraced just above 0.786 of Fibonacci Retracement. In the process of correction, it touched the cloud and advanced again further.
Look at Gann Chart of 21 years. Nifty's correction just ended below 2 X 1 angle around 2250 in the year 2008.
Where Nifty right now placed ?
As per Gann methodology, if it closes above 5712 and when technical validation is completed, its headed to first target of 9320.
One finer point you will note, Nifty invariably bottomsout in monthly chart when stochastic oscillator (parameter 8 , 4, 3 ) gets into oversold and turns on upside. This you can notice in the Gann Chart.
Importantly, I observe many talk about Nifty's direction and targets without understanding its rhythemic move. Nifty as a broad market Index, doesn't break 3 months low so easily in an uptrend and if it does it, then market goes in for a big correction. In the same vein, when it crosses 3 months high after a substantial correction, then upmove is put in place. But aberration to 3 months breakout of high and low are minimal, which you can observe from charts.
Now lets combine all the tools and see if we could arrive at logical conclusion.
Nifty is trading above ichimoku cloud and has made breakout of 3 months high with Stochastics of 8,4,3 is turningup from oversold region. All these are perfectly set for upmove.. but catch here is, from Gann methodology. Unless Nifty closes above 5712, there cannot be any substantial upmove. As market has already overrun on upside without a breather, probably could face stiff resistance between 5475 - 5575 which is again Gann level of resistance.
Once when Nifty closes above 5712 with technical validation in place, then Good days are ahead with a substantial move to 9320.
I have tried to explain you the advantage of using multiple tools to arrive for trading decisions than simply relying on a standalone methodology.
Best Wishes |
Hello Ramesh Sir...Fantastic explanation for finding the major trend of markets using various tools. You have explained everything in such a simple way. Moreover, you have provided a completely new dimension of looking into the markets which could not have occurred to me atleast in this life span ...  Thanks a lot sir.. Thanks a lot sir..
Sir, one doubt what do you mean by " if it closes above 5712 and when technical validation is completed" . What is technical validation ?
Sir i have one more doubt..are you using Advanced Get as your charting software ? If yes, then how to get Ichimoku indicator in AdGet. Also, do you also use Elliot waves for determining the impulsive and corrective phases of the market ?
Sir, i might be very small in front of you to ask this..But from the charts you have posted it appears that nifty has completed its fourth corrective wave and holding well above the channels. It is headed for the 5th impulsive wave now. The only factor which is not in favor and can lead to a failure 5th wave is the PTI which should be greater than 35 for high probability trade . Please correct me if i am wrong anywhere.
Thanks a lot in advance..
|
|
| Back to top |
|
 |
rameshraja
Expert

Joined: 24 Nov 2006
Posts: 1121
|
Post: #27  Posted: Sun Feb 19, 2012 7:19 pm Post subject: Posted: Sun Feb 19, 2012 7:19 pm Post subject: |
 |
|
Hello Trader Indian
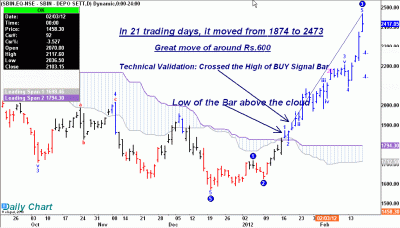
In technical analysis, whichever strategy you follow for Buying and selling, the signal needs to be validated by subsequent Price bar actions. If a buy is generated by any strategy, then next subsequent price bar/s should cross the high of the bar which signalled the BUY. For sell, its reverse. Once a sell is generated by any strategy, subsequent Price bar/s should break the low of Signal Bar. This is called " Technical Validation". Many Breakouts fadeout, if the above condition is not fulfilled.
To your other querry, Advancedget is one of the softwares I use for charting analysis. If you are using Licenced version, then Vendor can help you in getting ichimoku file.
I use EW analysis only to a limited extent of ADGET entry system. Theoretically, PTI below 35 doesn't give comfort for entry in the chart you are referring to, but on several occassions even with > 35 also system has failed.
No Trading System works 100% perfect and if it honours 75% of time itself, you are the Winner of market.
"The Proficient Tape Reader will doubtless prefer to discard all mechanical helps, because they interfere with his sensing the trend. Besides, if he keeps the chart himself the very act of running them distracts his attention from the tape on which his eye should be constantly riveted". By Richard D. Wyckoff
|
|
| Back to top |
|
 |
Osthevelan
White Belt

Joined: 14 Feb 2012
Posts: 1
|
Post: #28  Posted: Sun Feb 19, 2012 9:54 pm Post subject: Posted: Sun Feb 19, 2012 9:54 pm Post subject: |
 |
|

|
|
| Back to top |
|
 |
rameshraja
Expert

Joined: 24 Nov 2006
Posts: 1121
|
Post: #29  Posted: Sun Feb 19, 2012 11:18 pm Post subject: Posted: Sun Feb 19, 2012 11:18 pm Post subject: |
 |
|
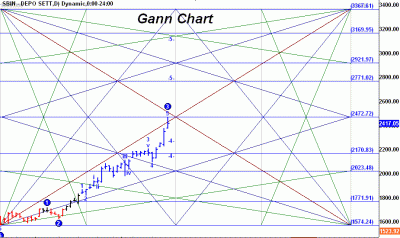
State Bank of India
Ichimoku Chart showing technical Validation.
Gann Chart showing Road Map for further moves.
| Description: |
|
| Filesize: |
40.76 KB |
| Viewed: |
788 Time(s) |

|
| Description: |
|
| Filesize: |
26.94 KB |
| Viewed: |
582 Time(s) |

|
|
|
| Back to top |
|
 |
pkholla
Black Belt

Joined: 04 Nov 2010
Posts: 2890
|
Post: #30  Posted: Mon Feb 20, 2012 10:25 am Post subject: Posted: Mon Feb 20, 2012 10:25 am Post subject: |
 |
|
rameshraja sir, what place does a market sentiment indicator have in your analysis? even as a minimum to confirm your TA?
A member of ICharts mgt regularly posts a chart showing medium and long term sentiment. The latest posting showed medium sentiment quite high BUT long term sentiment still to rise above zero. your comments? regards prakash holla
|
|
| Back to top |
|
 |
|
|
You cannot post new topics in this forum
You cannot reply to topics in this forum
You cannot edit your posts in this forum
You cannot delete your posts in this forum
You cannot vote in polls in this forum
You can attach files in this forum
You can download files in this forum
|
Powered by phpBB © 2001, 2005 phpBB Group
|
|
|

