| View previous topic :: View next topic |
| Author |
Swing Trading by Ichimoku Trading System |
rameshraja
Expert

Joined: 24 Nov 2006
Posts: 1121
|
Post: #31  Posted: Mon Feb 20, 2012 10:35 am Post subject: Posted: Mon Feb 20, 2012 10:35 am Post subject: |
 |
|
Mr Pkholla
I have no knowledge in Market sentiment Indicator.
|
|
| Back to top |
|
 |
|
|
 |
vinay28
Black Belt

Joined: 24 Dec 2010
Posts: 11748
|
Post: #32  Posted: Mon Feb 20, 2012 11:26 am Post subject: Posted: Mon Feb 20, 2012 11:26 am Post subject: |
 |
|
Dear Rameshraja
Your quote of Wyckoff reminded me of Wyckoff technique that I had posted some months ago on icharts although I can't find it now. According to that post, nifty was expected to go up sharply if did not violate about 5000 on down side. Nifty went down as much as 4531. Still nifty bounced back sharply.
Do you have any views on it?
|
|
| Back to top |
|
 |
rameshraja
Expert

Joined: 24 Nov 2006
Posts: 1121
|
Post: #33  Posted: Mon Feb 20, 2012 12:22 pm Post subject: Posted: Mon Feb 20, 2012 12:22 pm Post subject: |
 |
|
Mr Vinay
Attimes, any method / Strategy tend to fail. Technical Analysis is all about Probabilities. Its not a SCIENCE. Thats why we, have Stop Loss in trade.
Archimede's principle is a science, which states that a body immersed in a fluid is buoyed up by a force equal to the weight of the displaced fluid. This is a Science and cannot be disputed. Can we forecast security's direction of Price movement with certainty through Technical Analysis ? To my knowledge and understanding, its not possible.
|
|
| Back to top |
|
 |
vinay28
Black Belt

Joined: 24 Dec 2010
Posts: 11748
|
Post: #34  Posted: Mon Feb 20, 2012 12:36 pm Post subject: Posted: Mon Feb 20, 2012 12:36 pm Post subject: |
 |
|
| thank you rameshraja
|
|
| Back to top |
|
 |
chandrujimrc
Brown Belt

Joined: 21 Apr 2009
Posts: 1683
|
Post: #35  Posted: Mon Feb 20, 2012 9:27 pm Post subject: Posted: Mon Feb 20, 2012 9:27 pm Post subject: |
 |
|
Dear Rameshraja,
If you dont mind can you post your view about Yes bank and sesagoa as per this system ?
chandru.
|
|
| Back to top |
|
 |
rameshraja
Expert

Joined: 24 Nov 2006
Posts: 1121
|
Post: #36  Posted: Mon Feb 20, 2012 10:59 pm Post subject: Posted: Mon Feb 20, 2012 10:59 pm Post subject: |
 |
|
Mr Chandru
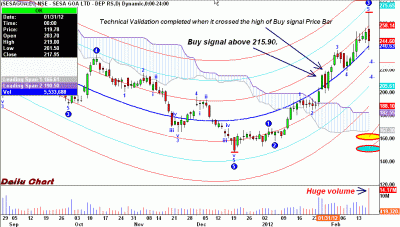
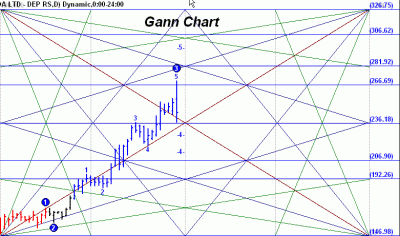
Look at the attached Chart of Sesa Goa as per Ichimoku Cloud and Gann.
I advise you to analyse by yourself for Yes Bank. Then only, you will get confidence of taking your own decisions. If I am not wrong, ichimoku is available in Platinum charts. Just give a try.
| Description: |
|
| Filesize: |
42.73 KB |
| Viewed: |
828 Time(s) |

|
| Description: |
|
| Filesize: |
21.21 KB |
| Viewed: |
606 Time(s) |

|
|
|
| Back to top |
|
 |
vinst
Black Belt

Joined: 09 Jan 2007
Posts: 3303
|
Post: #37  Posted: Fri Feb 24, 2012 11:03 am Post subject: Posted: Fri Feb 24, 2012 11:03 am Post subject: |
 |
|
| BNF makes full candle below cloud with low of candle at 10555.
|
|
| Back to top |
|
 |
traderindian
White Belt

Joined: 03 Apr 2010
Posts: 56
|
Post: #38  Posted: Mon Feb 27, 2012 10:49 pm Post subject: Posted: Mon Feb 27, 2012 10:49 pm Post subject: |
 |
|
Hello Ramesh Sir..
Thanks a lot for the excellent explanation along with the charts.. 
|
|
| Back to top |
|
 |
manass
White Belt

Joined: 21 Sep 2009
Posts: 172
|
Post: #39  Posted: Sat Mar 10, 2012 1:34 pm Post subject: Posted: Sat Mar 10, 2012 1:34 pm Post subject: |
 |
|
HI RR, nice work. Thanks
Regards
|
|
| Back to top |
|
 |
Moody
White Belt

Joined: 05 Mar 2009
Posts: 6
|
Post: #40  Posted: Sat Mar 10, 2012 3:13 pm Post subject: Posted: Sat Mar 10, 2012 3:13 pm Post subject: |
 |
|
Dear Rameshraja,
sorry for diverting the topic a bit .. it is said that Gann new a technique using which he could accurately forcast @ what date and time the underlying security would bottom out or top out (calculating rate of vibration of stocks/commosities ).his Risk to rewards used to be around 1:100 with very high accuracy .
On top of the all,
I met a person some time ago, to be precise nov4th2011-nifty spot close @5284.20.
what is let me know is nifty would would see bottom of 4527 on 19dec 2011 & i was amazed experience the accuracy(4531 low on 19dec2011 ) 
-he claims it to be mathematics---
after watching your posts, you seem to be a persom who knows much abt Gann-do u believe such thing exists ?
|
|
| Back to top |
|
 |
vishyvaranasi
Green Belt

Joined: 11 Jul 2011
Posts: 1159
|
Post: #41  Posted: Sat Mar 10, 2012 4:35 pm Post subject: Ichimoku Posted: Sat Mar 10, 2012 4:35 pm Post subject: Ichimoku |
 |
|
Rameshraja,
As said by you, yes Ichimoku is available in Platinum.I had tried that but as seen in your charts there isnt any cloud formation.So can u help in this issue.
Vishy
|
|
| Back to top |
|
 |
vinst
Black Belt

Joined: 09 Jan 2007
Posts: 3303
|
Post: #42  Posted: Mon Mar 12, 2012 8:38 pm Post subject: Posted: Mon Mar 12, 2012 8:38 pm Post subject: |
 |
|
| vinst wrote: | | BNF makes full candle below cloud with low of candle at 10555. |
RR sir,
How to book profits according to Ichimoku?
After this short position, bnf made low of 10002 on 7-March.
|
|
| Back to top |
|
 |
vinst
Black Belt

Joined: 09 Jan 2007
Posts: 3303
|
Post: #43  Posted: Mon Mar 12, 2012 8:40 pm Post subject: Posted: Mon Mar 12, 2012 8:40 pm Post subject: |
 |
|
reliance ind (cash) makes full candle abv cloud on daily chart.
If high of 803 crossed next day, then reliance ind could be bought.
|
|
| Back to top |
|
 |
rameshraja
Expert

Joined: 24 Nov 2006
Posts: 1121
|
Post: #44  Posted: Wed Mar 28, 2012 7:13 pm Post subject: Posted: Wed Mar 28, 2012 7:13 pm Post subject: |
 |
|
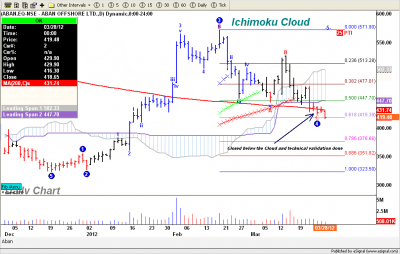
Aban below Ichimoku Cloud and below 200 days SMA
| Description: |
|
| Filesize: |
48.84 KB |
| Viewed: |
706 Time(s) |

|
|
|
| Back to top |
|
 |
rameshraja
Expert

Joined: 24 Nov 2006
Posts: 1121
|
Post: #45  Posted: Sat Apr 07, 2012 10:30 am Post subject: Posted: Sat Apr 07, 2012 10:30 am Post subject: |
 |
|
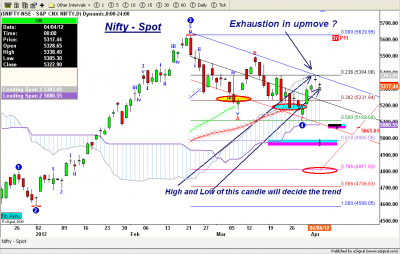
Nifty move crucially poised !!
| Description: |
|
| Filesize: |
56.73 KB |
| Viewed: |
762 Time(s) |

|
|
|
| Back to top |
|
 |
|

