| View previous topic :: View next topic |
| Author |
Swing Trading by Ichimoku Trading System |
rameshraja
Expert

Joined: 24 Nov 2006
Posts: 1121
|
Post: #1  Posted: Wed Feb 08, 2012 10:47 pm Post subject: Swing Trading by Ichimoku Trading System Posted: Wed Feb 08, 2012 10:47 pm Post subject: Swing Trading by Ichimoku Trading System |
 |
|
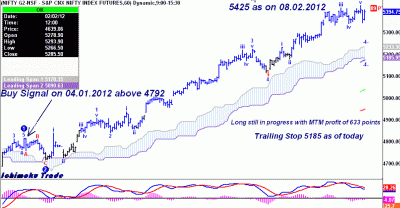
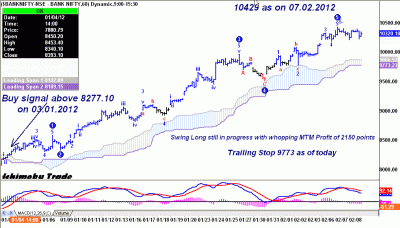
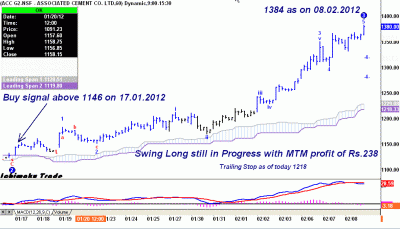
There are innumerable strategies that we can make use for trading. Amongst all, I personally prefer to Swing trade by Ichimoku trading strategy.
I always look at price and its action. I simplified this system to my comfortable tolerance level in trading with following rules.
1. I trade only with clouds of Ichimoku , and don’t look at any other indicators of the System
2. My timeframe setting is 60 Minutes
3. I will Buy only when Price Bar closes above Cloud and low of the price bar should be above cloud.
4. Next important condition being, the high of that bar should be takenout for Technical Validation.
5. Trail the trade till the Price Bar closes below the cloud and that bar low is takenout for technical validation to ensure that previous trend has changed.
6. I will book partial profit even when the price test the cloud.
7. Early warning of trend change, when price test the cloud after substantial gap between Cloud and Price.
For Swing Short: Its vice versa.
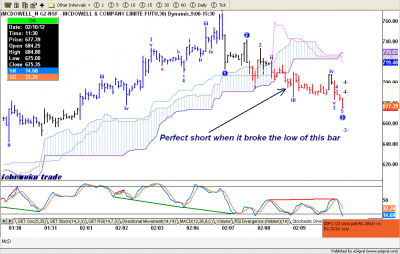
1. Short when price closes below the Cloud and high of the bar should be lower than cloud. Next condition, subsequent bars should takeout the low of that Price bar for technical validation.
2. Trail the trade till the Price bar closes above cloud and completes validation by takingout its high. Then Exit the short trade completely.
3. Early warning of trend change, when price test the cloud after substantial gap between Cloud and Price.
If your want to learn more about Ichimoku Trading system, read the book title given below:
Trading with Ichimoku Clouds ..
The Essential Guide to Ichimoku Kinko Hyo by Manesh Patel, CTA
| Description: |
|
| Filesize: |
36.36 KB |
| Viewed: |
1747 Time(s) |

|
| Description: |
|
| Filesize: |
39.88 KB |
| Viewed: |
1135 Time(s) |

|
| Description: |
|
| Filesize: |
34.4 KB |
| Viewed: |
963 Time(s) |

|
|
|
| Back to top |
|
 |
|
|
 |
svkum
White Belt

Joined: 14 Feb 2007
Posts: 321
|
Post: #2  Posted: Wed Feb 08, 2012 11:00 pm Post subject: Posted: Wed Feb 08, 2012 11:00 pm Post subject: |
 |
|
| IS THIS ICHIMOKU CLOUD SYSTEM AVAILABLE IN PLATINUM CHARTS?
|
|
| Back to top |
|
 |
sonila
Brown Belt

Joined: 04 Jun 2009
Posts: 1786
|
Post: #3  Posted: Wed Feb 08, 2012 11:28 pm Post subject: Posted: Wed Feb 08, 2012 11:28 pm Post subject: |
 |
|
| Is this chart avlbl in ichart ?
|
|
| Back to top |
|
 |
kamal.icharts
Site Admin
Joined: 10 Apr 2013
Posts: 576
|
Post: #4  Posted: Thu Feb 09, 2012 9:15 am Post subject: Posted: Thu Feb 09, 2012 9:15 am Post subject: |
 |
|
The IChimoku indicator is available in Platinum.
Regards
Kamal
|
|
| Back to top |
|
 |
mayurnsk
Moderator
Joined: 18 Jan 2007
Posts: 216
Location: Nasik, Maharashtra
|
Post: #5  Posted: Thu Feb 09, 2012 11:21 am Post subject: Posted: Thu Feb 09, 2012 11:21 am Post subject: |
 |
|
Rameshraja Sir Hello & Goodmorning !!
Nice system!! Yet another simple system.
And now we have that Ichimoku Indicator here in icharts in platinum... hence it can be used.... I like larger timeframes hence it suits me 
Regards
mayurnsk
|
|
| Back to top |
|
 |
rameshraja
Expert

Joined: 24 Nov 2006
Posts: 1121
|
Post: #6  Posted: Thu Feb 09, 2012 12:25 pm Post subject: Posted: Thu Feb 09, 2012 12:25 pm Post subject: |
 |
|
Mr Mayur
GM. higher the time frame it works efficiently as the system is based on Moving Average.
Best wishes
|
|
| Back to top |
|
 |
SAKLECHA
White Belt

Joined: 26 Jan 2010
Posts: 333
|
Post: #7  Posted: Thu Feb 09, 2012 1:12 pm Post subject: Posted: Thu Feb 09, 2012 1:12 pm Post subject: |
 |
|
DEAR KAMALJI,
IT IS ASKING FOR USERID AND PASSWORD.........I AM INTRADAY CHART PREMIUM SUBSCRIBER, CAN I LOGIN USING THE SAME ID.
THANKS
| kamal.icharts wrote: | The IChimoku indicator is available in Platinum.
Regards
Kamal |
|
|
| Back to top |
|
 |
kamal.icharts
Site Admin
Joined: 10 Apr 2013
Posts: 576
|
Post: #8  Posted: Thu Feb 09, 2012 1:21 pm Post subject: Posted: Thu Feb 09, 2012 1:21 pm Post subject: |
 |
|
Dear Member,
Please email to support@icharts.in and they will provide you the username and password to access the Platinum charts.
Regards
Kamal
|
|
| Back to top |
|
 |
traderindian
White Belt

Joined: 03 Apr 2010
Posts: 56
|
Post: #9  Posted: Thu Feb 09, 2012 7:50 pm Post subject: Posted: Thu Feb 09, 2012 7:50 pm Post subject: |
 |
|
Hello Ramesh sir, nice strategy on Ichimoku kumo clouds..A few months back i thought to trade based on ichimoku clouds only..(cloud to cloud) but i had some doubts and wanted to clear it from someone who is actually trading on this.. Thanks for the initiative..Can you please answer the following queries:
a) is there any way to avoid whipsaws (price frequently going above and below cloud) or minimize the losses during sideways market in this strategy or we just follow the system signal to signal as nicely explained by you?
b) how do we tackle gap up or gap downs in this strategy. for ex. if during a short trade , market gaps up above the cloud or vice-versa ?
c) how do we tackle the situations where initial stoploss is too large i.e.diff between price and cloud is large at the time of breakout
d) are you trading on this strategy regularly and since how long ?
e) do you trade this strategy only on indices (nifty and bank nifty) or stocks also
Thanks in advance. Will really appreciate your comments on above queries.
|
|
| Back to top |
|
 |
rameshraja
Expert

Joined: 24 Nov 2006
Posts: 1121
|
Post: #10  Posted: Fri Feb 10, 2012 11:53 am Post subject: Posted: Fri Feb 10, 2012 11:53 am Post subject: |
 |
|
Mcdowell is trending down
| Description: |
|
| Filesize: |
49.67 KB |
| Viewed: |
1022 Time(s) |

|
|
|
| Back to top |
|
 |
vishyvaranasi
Green Belt

Joined: 11 Jul 2011
Posts: 1159
|
Post: #11  Posted: Fri Feb 10, 2012 12:32 pm Post subject: Posted: Fri Feb 10, 2012 12:32 pm Post subject: |
 |
|
| rameshraja wrote: | | Mcdowell is trending down |
Hi rameshraja,
Yesterday i had actually looged into the platinum to test ichimoku, but when trying to apply the indicator its not coming. So is there any prerequisite data required for ichimoku like say 10 days or so or wat might be the problem. pl clarify
Vishy
|
|
| Back to top |
|
 |
rameshraja
Expert

Joined: 24 Nov 2006
Posts: 1121
|
Post: #12  Posted: Fri Feb 10, 2012 6:08 pm Post subject: Posted: Fri Feb 10, 2012 6:08 pm Post subject: |
 |
|
Hello vishy
Formulas for ichimoku
Tenkan Line: (highest high + lowest low)/2 calculated over last 9 periods.
Kijun Line: (highest high + lowest low)/2 calculated over last 26 periods.
Chikou Span: (most current closing price plotted 26 time periods back.
Senkou Span A: (Tenkan line + Kijun Line)/2 plotted 26 time periods ahead
Senkou Span B: (highest high + lowest low)/2 calculated over past 52 time periods, sent 26 periods ahead.
Therefore, obviously you need large datas for indicator to be used.. Atleast a minimum of 150 to 200 Price bars to get to know about the trend.
|
|
| Back to top |
|
 |
rameshraja
Expert

Joined: 24 Nov 2006
Posts: 1121
|
Post: #13  Posted: Fri Feb 10, 2012 9:31 pm Post subject: Posted: Fri Feb 10, 2012 9:31 pm Post subject: |
 |
|
Hello Trader Indian
Sorry for late replying to your querry.
To avoid whipsaws or to minimize the losses in sideways market, use Higher Time Frame like 60M / Daily and weekly.
Try using the rules which I have mentioned in the thread, as these were fine tuned to have high probable trades.
Initial Stops on breakout will tend to be large and if my conditions for takingup trade is fulfilled, and if you are averse to taking big risk, then wait for price to come closer to cloud to initiate trade.
I am using this method for more than couple of years and I don’t use this as standalone methodology to initiate swing trade, as I rely more on my proprietory trading system along with Gann to have self fulfilling prophecy in search of edge for trading.
As a matter of fact, I don’t use any single methodology for my Day / Swing trading and use combination of tools to ensure that I am not at the wrongside of market.. despite that I loose heavily at times when I have loose Stops in place.
Trade Well and follow the Trend !!
Best Wishes
|
|
| Back to top |
|
 |
vinay28
Black Belt

Joined: 24 Dec 2010
Posts: 11748
|
Post: #14  Posted: Fri Feb 10, 2012 9:41 pm Post subject: Posted: Fri Feb 10, 2012 9:41 pm Post subject: |
 |
|
.. despite that I loose heavily at times when I have loose Stops in place.
Great Rameshraja! How many experts have the courage and the humility to admit this? Salute! Only this quality separates a few from the rest.
|
|
| Back to top |
|
 |
som09
White Belt

Joined: 03 Jan 2011
Posts: 17
|
Post: #15  Posted: Fri Feb 10, 2012 9:47 pm Post subject: Posted: Fri Feb 10, 2012 9:47 pm Post subject: |
 |
|
hello ramesh raja sir,
will you clarify tht how to apply this indicator in platinum with parameter
please.
regards,
sachin
|
|
| Back to top |
|
 |
|

