| View previous topic :: View next topic |
| Author |
Swing Trading : The Speculator way |
shekharinvest
Yellow Belt

Joined: 21 Dec 2007
Posts: 549
|
Post: #16  Posted: Wed Jan 27, 2010 4:27 pm Post subject: Posted: Wed Jan 27, 2010 4:27 pm Post subject: |
 |
|
Posted below are charts for
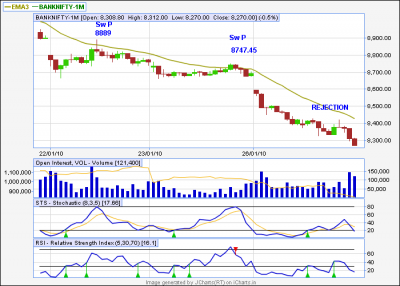
i) BNF 20 min with 21 ema
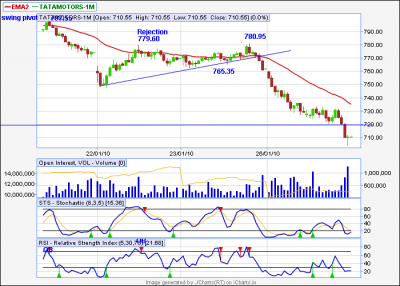
ii) Tatamotors - 1M 15 min with 34 ema
Which appears to fit nicely into spec. swing trading methodology.
Please share your veiws.
SHEKHAR
| Description: |
|
| Filesize: |
30.08 KB |
| Viewed: |
1312 Time(s) |
|
| Description: |
|
| Filesize: |
24.56 KB |
| Viewed: |
1134 Time(s) |
|
|
|
| Back to top |
|
 |
|
|
|
shekharinvest
Yellow Belt
Joined: 21 Dec 2007
Posts: 549
|
| Post: #17 Posted: Thu Jan 28, 2010 4:17 pm Post subject: |
|
|
Hi,
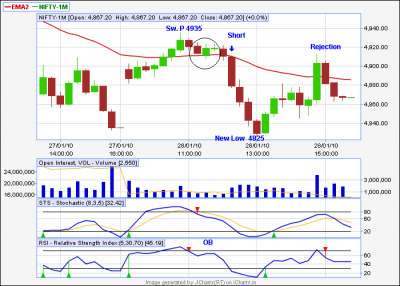
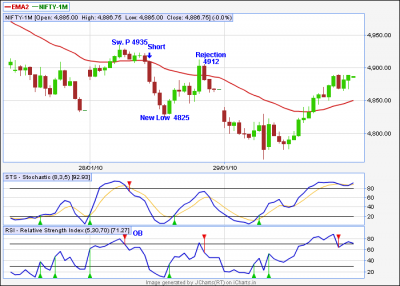
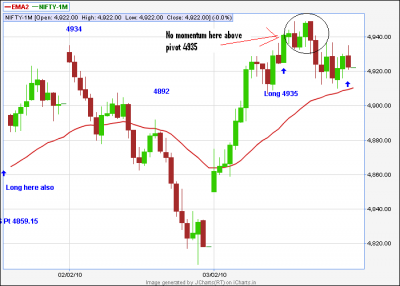
Price got rejected from 34 hence short once the candle closed below 34. Please note that mid range shorts are only for Intraday purposes, and needs to be carried over only once it is in decent profits - price went on to make new low hence the new swing pivot is formed at 4935.
One necessary correction suggested by Speculator while going for type 2 entry.
Whenever the price moves above 34 and comes back to 34 for rejection the green candle must close above the previous candle's high, to initiate longs. Reverse for shorts.
In todays case this did not happen hence we were saved from going long @ 4912-20 range. Marked in black circle.
SHEKHAR
| Description: |
|
| Filesize: |
35.89 KB |
| Viewed: |
1290 Time(s) |
|
|
|
| Back to top |
|
|
shekharinvest
Yellow Belt
Joined: 21 Dec 2007
Posts: 549
|
| Post: #18 Posted: Thu Jan 28, 2010 4:39 pm Post subject: |
|
|
Hi,
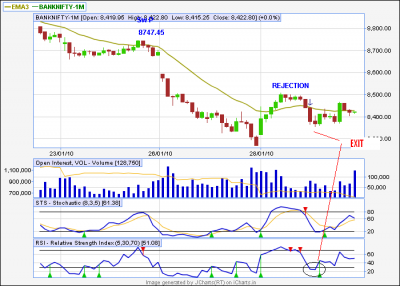
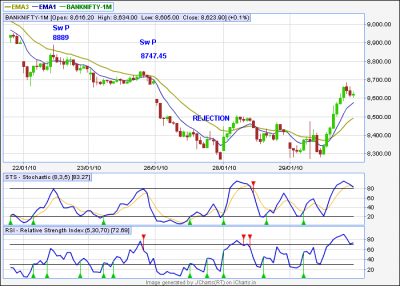
Posted below is chart for BNF.
RSI has come out of oversold area and price did not make new low hence sideways movement. Shorts to be closed if not already booked.
Probably we might get type 2 entry in BNF, although swing pivot is far off at 8747.5
SHEKHAR
| Description: |
|
| Filesize: |
36.19 KB |
| Viewed: |
1170 Time(s) |
|
|
|
| Back to top |
|
|
Speculator
Expert

Joined: 15 Apr 2008
Posts: 149
|
|
| Back to top |
|
|
shekharinvest
Yellow Belt
Joined: 21 Dec 2007
Posts: 549
|
| Post: #20 Posted: Sun Jan 31, 2010 1:07 pm Post subject: |
|
|
Speculator,
Thanks for recent updates.
I have placed all these updates at the end of the original document and attached the file with the post.
Hope ppl will find it convenient to go through all this at one place.
SHEKHAR
| Description: |
|

Download |
| Filename: |
Swing Trading -The Speculator Way.doc |
| Filesize: |
253 KB |
| Downloaded: |
1898 Time(s) |
|
|
| Back to top |
|
|
shekharinvest
Yellow Belt
Joined: 21 Dec 2007
Posts: 549
|
| Post: #21 Posted: Sun Jan 31, 2010 2:18 pm Post subject: |
|
|
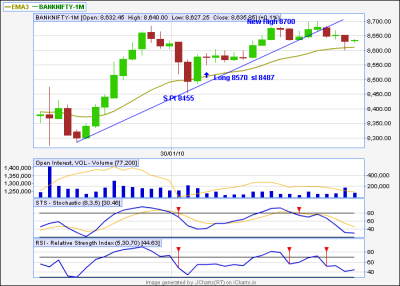
Hi,
Posted below are charts.
NF: Price has moved above 34 ema, yet swing pivot is to be taken out, which is now at 4912.
BNF: After the Rejection price failed to make new low hence the pivot is still at 8747.5 Here also price has moved much above the 34 ema but swing pivot still intact. wait and watch.
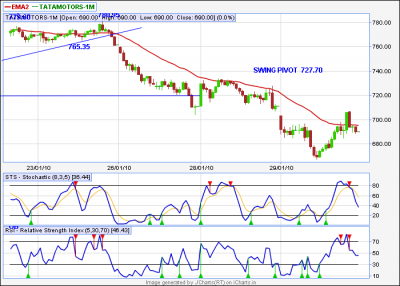
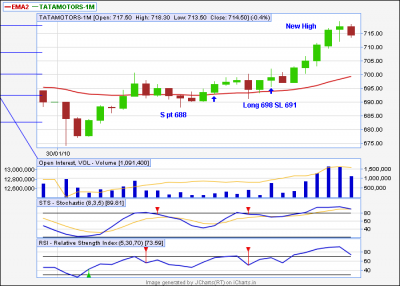
Tatamotors has barely moved above 34 ema and went below 34 again here the swing pivot is at 727.7
All the three needs to be watched if they can give us an entry on the long side on Monday. Until then we are in the downtrend.
SHEKHAR
| Description: |
|
| Filesize: |
25.92 KB |
| Viewed: |
1169 Time(s) |
|
| Description: |
|
| Filesize: |
32.94 KB |
| Viewed: |
1049 Time(s) |
|
| Description: |
|
| Filesize: |
32.98 KB |
| Viewed: |
949 Time(s) |
|
|
|
| Back to top |
|
|
kingrahman
White Belt

Joined: 20 Feb 2009
Posts: 5
|
| Post: #22 Posted: Mon Feb 01, 2010 10:13 am Post subject: |
|
|
| hi friends,keep up the good ,hankyoutwork wonderful post
|
|
| Back to top |
|
|
shekharinvest
Yellow Belt
Joined: 21 Dec 2007
Posts: 549
|
| Post: #23 Posted: Mon Feb 01, 2010 4:23 pm Post subject: |
|
|
Hi,
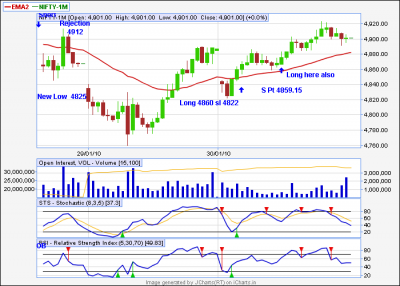
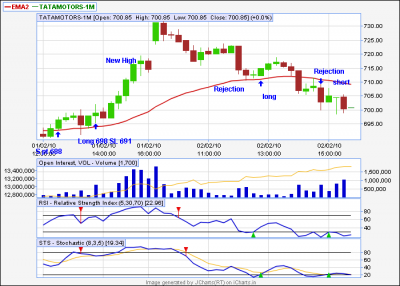
Today all the three gave entry as type - 2, i.e. after price rejection from 34 EMA.
We are long on:
NF from 4860
BNF 8570
Tatamotors 698
Although, previous swing pivots are not taken out yet except NF which later surrendered the gains. After conquering the pivots uptrend will be confirmed and it will be buy on dips to 34.
Swing pivots on the lower side - for reversal to shorts - has been made today as shown in charts. ( Speculator I need confirmation on that from you. This is how I have understood.)
SHEKHAR
| Description: |
|
| Filesize: |
25.26 KB |
| Viewed: |
1304 Time(s) |
|
| Description: |
|
| Filesize: |
28.24 KB |
| Viewed: |
1106 Time(s) |
|
| Description: |
|
| Filesize: |
22.03 KB |
| Viewed: |
1099 Time(s) |
|
|
|
| Back to top |
|
|
sandew
White Belt
Joined: 02 Feb 2009
Posts: 174
|
| Post: #24 Posted: Mon Feb 01, 2010 4:41 pm Post subject: Question on Swing Low |
|
|
| At around 0930 today Feb 1st, low was made around 4822, the 34 ema conquered and later a high surpassed the past Swing high of 4912. As i understand, (a) we fell below 34, (b) conquered it and (c) finally surpassed last Swing High of 4912 = Thus, 4822 now becomes the New Swing Low. Is my reading of Swing Low correct?
|
|
| Back to top |
|
|
shekharinvest
Yellow Belt
Joined: 21 Dec 2007
Posts: 549
|
| Post: #25 Posted: Tue Feb 02, 2010 9:01 am Post subject: |
|
|
Thnx Sandew,
Yes that is the clear pivot, but I have taken the view that prices have moved above 34 EMA and got the fresh rejection at 4859 and then went on to make new high hence the pivot.
On Tatamotors I am wrong the pivot I have shown is not a pivot since prices have not moved much beyond 34 ema at that point of time, therefore there is no pivot to reverse on tatamotors that could at best be a point to fix as SL.
SHEKHAR
|
|
| Back to top |
|
|
Speculator
Expert
Joined: 15 Apr 2008
Posts: 149
|
| Post: #26 Posted: Tue Feb 02, 2010 3:57 pm Post subject: |
|
|
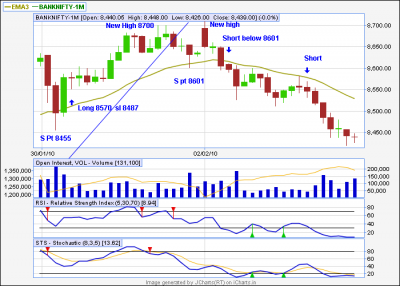
Yesterday we took out the prior downswing pivot at 4912.90. Typically when a prior downswing pivot is taken out with a bullish candle, we see huge price acceleration to the upside. We did not see that happen yesterday, instead we closed back below the swing pivot. The fact that we did not see price acceleration was an indiaction that that we are in a sideways range.
Today we made another attempt to take out the 4912.90 pivot and failed to hold the gains. That was a warning to get cautious on the longs. I posted a few times in SB today to trail the stops on the longs as the market was not showing trending behaviour. Finally today we had a rejection from the 34 ema on both 15-min and 30-min, which was a signal to go short. The signal had follow thru and finally broke the upswing pivot at 4822.50, which means the swing signal is now back to down again.
| Description: |
|
| Filesize: |
22.85 KB |
| Viewed: |
1536 Time(s) |
|
|
|
| Back to top |
|
|
shekharinvest
Yellow Belt
Joined: 21 Dec 2007
Posts: 549
|
| Post: #27 Posted: Tue Feb 02, 2010 4:19 pm Post subject: |
|
|
Thnx Speculator for the writeup.
Poted below the charts for BNF and Tatamotors, with todays action.
SHEKHAR
| Description: |
|
| Filesize: |
27.84 KB |
| Viewed: |
1153 Time(s) |
|
| Description: |
|
| Filesize: |
25.75 KB |
| Viewed: |
1043 Time(s) |
|
|
|
| Back to top |
|
|
smsmss
White Belt
Joined: 13 Oct 2009
Posts: 123
|
| Post: #28 Posted: Tue Feb 02, 2010 10:32 pm Post subject: |
|
|
| thanx again spec and shekhar for charts and descriptions.......this thread is rocking with ur inputs...
|
|
| Back to top |
|
|
girishhu1
White Belt
Joined: 17 Aug 2009
Posts: 316
|
| Post: #29 Posted: Wed Feb 03, 2010 7:36 am Post subject: |
|
|
Hi speculatorji,
very nice strategy. Thanks for sharing.
also thanks due to shekharinvest for his interpretations with examples.
|
|
| Back to top |
|
|
shekharinvest
Yellow Belt
Joined: 21 Dec 2007
Posts: 549
|
| Post: #30 Posted: Wed Feb 03, 2010 4:27 pm Post subject: |
|
|
Hi,
Nothing much to write home about. Whips only.
Posting chart for NF only today. Story is almost same everywhere.
Here are the views of Speculator on today's event and actions taken.
4934.95 to 4807 is one swing. It broke the prior pivot at 4822 yesterday. So 4934.95 is the new downswing pivot. When you have multiple pivots as a part of the same swing, then choose the highest one. In this case 4934.95.
Hourly NF closed below the 4935 swing pivot. Not a good sign
I closed my swing position for break even.
We came close to a confirmation today, but failed on the hourly
Right now it's a trading range mess. Rewarding for intraday guys and whipsaws for swing guys.
By all means trade the 34 ema rejections, but do not carry overnight positions, unless you can handle 50-100 point risks. The time to carry overnight positions is when we get swing reversal confirmation.
SHEKHAR
| Description: |
|
| Filesize: |
22.27 KB |
| Viewed: |
1303 Time(s) |
|
|
|
| Back to top |
|
|
|


