| View previous topic :: View next topic |
| Author |
Swing Trading : The Speculator way |
smsmss
White Belt

Joined: 13 Oct 2009
Posts: 123
|
Post: #151  Posted: Fri May 14, 2010 8:40 pm Post subject: Posted: Fri May 14, 2010 8:40 pm Post subject: |
 |
|
hi Spec, thanx for your inputs as always. Both technicals and fundamentals are looking very weak at the moment. Greece bailout announced but Spain and Portugal are still in line. Lets see what next week holds for us.and one more thing, Lets not worry about others' laughter but enjoy the trading.have a nice weekend. cheers.   
|
|
| Back to top |
|
 |
|
|
 |
shekharinvest
Yellow Belt

Joined: 21 Dec 2007
Posts: 549
|
Post: #152  Posted: Sat May 15, 2010 2:40 pm Post subject: Posted: Sat May 15, 2010 2:40 pm Post subject: |
 |
|
Speculator,
Thnx for the post and your view on the fundamentals.
SHEKHAR
|
|
| Back to top |
|
 |
optimist
White Belt

Joined: 06 May 2010
Posts: 18
|
Post: #153  Posted: Sat May 15, 2010 4:01 pm Post subject: Posted: Sat May 15, 2010 4:01 pm Post subject: |
 |
|
Hi Spec,
Thanks for your views which are always invaluable
Shiva
|
|
| Back to top |
|
 |
Speculator
Expert

Joined: 15 Apr 2008
Posts: 149
|
Post: #154  Posted: Mon May 17, 2010 9:28 am Post subject: Posted: Mon May 17, 2010 9:28 am Post subject: |
 |
|
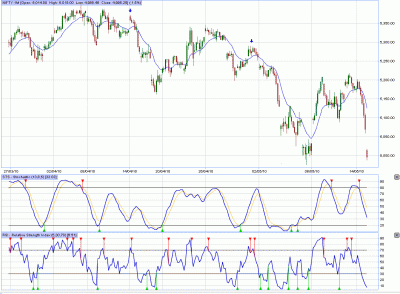
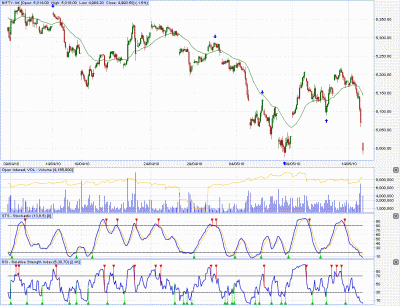
Last week the 30-min gave a swing buy which only produced a anemic bounce. The 60-min however, has remained on a sell. Needless to say, higher timeframe charts are more reliable. I will try to post both the 30-min and 60-min swing pivot charts.
I personally trade the 30-min charts, since the SL is smaller. I use the 60-min to determine the overall trend.
| Description: |
|
| Filesize: |
47.49 KB |
| Viewed: |
731 Time(s) |

|
| Description: |
|
| Filesize: |
60.29 KB |
| Viewed: |
655 Time(s) |

|
|
|
| Back to top |
|
 |
Speculator
Expert

Joined: 15 Apr 2008
Posts: 149
|
Post: #155  Posted: Tue May 18, 2010 8:18 am Post subject: Posted: Tue May 18, 2010 8:18 am Post subject: |
 |
|
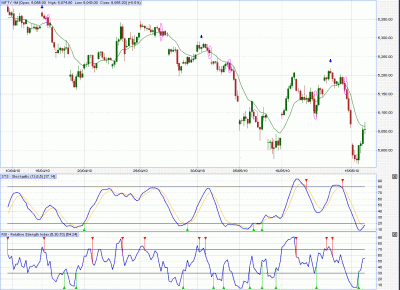
The downswing pivot now moves to 5218. The 60-min Stochastic is oversold. So we have another bounce to releive the oversold condition. Volatility and range has come back to Nifty and it has become very tradeable now, with good profit potential.
I got a PM asking me to show the chart of setups rather than just the pivots. The answer has been and will remain the same. Check the trade Entry, Exit and Stop guidelines topic. Trade entry is either based on break of swing pivot or rejections. Nothing new there. Break of swing pivot happens once in a month or two. So one cannot rely on that alone. Rejections are the bread and butter of swing pivot trading system.
For those new to swing pivots, for Nifty 15-min and 30-min timeframe use rejections from 34 ema and for 60-min use rejections from 13 ema. For 30-min and 60-min, we don't get true rejections like in 15-min. So one has to just use a cross of the ema rather than rejection. Also don't forget that rejection candles need to have a close below the prior candle low for bearish rejections and a close above the prior candle high for bullish rejections. I have marked the 60-min chart with all the rejection setups over the last 15 days.
For exits, one can book 50% profits on 80-100 nifty points. The rest half can be closed on a swing reversal (if one is trading from swing entry to swing reversal) or trail the hourly candles (if one trading only a section of the swing). It's a personal preference.
I will be on a vacation and will be back on June 1. Won't be posting any updates until then.
Good luck trading !
-Speculator
| Description: |
|
| Filesize: |
53.76 KB |
| Viewed: |
805 Time(s) |

|
|
|
| Back to top |
|
 |
sandew
White Belt

Joined: 02 Feb 2009
Posts: 174
|
Post: #156  Posted: Tue May 18, 2010 10:10 am Post subject: HI Posted: Tue May 18, 2010 10:10 am Post subject: HI |
 |
|
Hi Spec,
1. Your post of May 17th. In the 60 min chart the 5207 high was taken-out by subsequent upshot of 5218, thereby establishing a new uptrend. (it later on reversed though, still the previous 5207 was taken out first).
2. I for one, see similar taking out of 5207 on 30 min chart as clearly.
3. So, in what manner using this 60 min chart more effective & different than the given 30 min chart, for purpose of determining the trend? The ignorant me is unable to comprehend the differentiation you are trying to highlight. Please elucidate.
Thank You
Last edited by sandew on Wed May 26, 2010 10:22 am; edited 1 time in total |
|
| Back to top |
|
 |
smsmss
White Belt

Joined: 13 Oct 2009
Posts: 123
|
|
| Back to top |
|
 |
smsmss
White Belt

Joined: 13 Oct 2009
Posts: 123
|
|
| Back to top |
|
 |
smsmss
White Belt

Joined: 13 Oct 2009
Posts: 123
|
|
| Back to top |
|
 |
Speculator
Expert

Joined: 15 Apr 2008
Posts: 149
|
|
| Back to top |
|
 |
optimist
White Belt

Joined: 06 May 2010
Posts: 18
|
Post: #161  Posted: Thu Jun 03, 2010 2:14 pm Post subject: Posted: Thu Jun 03, 2010 2:14 pm Post subject: |
 |
|
Hi Spec,
Thanks for your valuable insights. Please keep updating this thread whenever possible for others to benefit
|
|
| Back to top |
|
 |
optimist
White Belt

Joined: 06 May 2010
Posts: 18
|
Post: #162  Posted: Thu Jun 03, 2010 3:16 pm Post subject: Posted: Thu Jun 03, 2010 3:16 pm Post subject: |
 |
|
Hi Spec,
What time frame do you follow usually. I saw you following 15 mins sometimes and 30 mins some times .
I know tht u take 60 mins to know the trend though you dont take decisions based on that
|
|
| Back to top |
|
 |
sandew
White Belt

Joined: 02 Feb 2009
Posts: 174
|
Post: #163  Posted: Thu Jun 03, 2010 9:37 pm Post subject: Hi Posted: Thu Jun 03, 2010 9:37 pm Post subject: Hi |
 |
|
Hi Spec,
1. Entered long on break of 13 ema on June 2. Nifty had a sharp rise, so took profit and exit. No overnight position.
2. June 3 opened gap up and stayed that way all day long. How would one trade on June 3, i.e. today, if we had no overnight position. what set-ups , what time frames, what targets and what SLs for trade on June 3.
Will delete this post after yr reply to avoid clutter.
Thank You
|
|
| Back to top |
|
 |
Speculator
Expert

Joined: 15 Apr 2008
Posts: 149
|
Post: #164  Posted: Fri Jun 04, 2010 8:01 am Post subject: Posted: Fri Jun 04, 2010 8:01 am Post subject: |
 |
|
optimist,
2009 was a dynamic bull market with a nice range. I traded only 15-min charts in 2009. With drop in volatiltity this year, i switched to 30-min and 60-min, which i mentioned on this forum sometime back. I trade both timeframes, depending on where i get the best setup. Lately, 60-min has been giving the best setups.
Sandew,
I had marked the setup with a circle yesterday, which was the close above 13 ema on 60-min. If you didn't take the setup, you didn't make money. After the gap-up, there was nothing to do but sit and watch or take partial profits. SL should be below the hourly bar (NF 4975). There is no need to delete your reply as it's a legitimate question related to swing pivot trading.
- Speculator
|
|
| Back to top |
|
 |
smsmss
White Belt

Joined: 13 Oct 2009
Posts: 123
|
Post: #165  Posted: Sun Jun 06, 2010 2:29 am Post subject: Posted: Sun Jun 06, 2010 2:29 am Post subject: |
 |
|
Spec, according to the system there were only two ways for entering in a position.the setup which u r mentioning is in neither of the two.if you consider the 30 min tf then u will notice that , the candle on 2nd june also made the RSI overbought without making the new high which was a weak signal. so i too got out of trade and got in again the next day with the gap up which broke the swing pivot again of 5023, and made the new swing pivot of uptrend at 4933. i am in the trade from 5072.
if there are any new observation or learnings regarding the 60 min tf kindly let us know.
cheers.   
|
|
| Back to top |
|
 |
|

