| View previous topic :: View next topic |
| Author |
Swing Trading : The Speculator way |
Amigo
White Belt

Joined: 17 Jun 2011
Posts: 223
|
Post: #1606  Posted: Sat Apr 28, 2012 2:30 pm Post subject: Posted: Sat Apr 28, 2012 2:30 pm Post subject: |
 |
|
i second smartcancerian's views.. this confusion pops up every month due to premium difference in the future contracts.. i suggest consulting only new series levels or we can consult Nifty spot levels as third umpire confirmation to maintain the simplicity of the method.. it is such a simple yet wonderful method for which i am indebted to Spect sir and all the senior mentors.
Regards
Amigo.
|
|
| Back to top |
|
 |
|
|
|
smartcancerian
Yellow Belt

Joined: 07 Apr 2010
Posts: 542
|
| Post: #1607 Posted: Sat Apr 28, 2012 8:22 pm Post subject: |
|
|
@ amigo.yes...even nifty spot chart can be consulted for this particular one or two day shift over..after one or two days, market gives new pivot at its own in N.Future according to current series.. 
|
|
| Back to top |
|
|
singh.ravee
Yellow Belt
Joined: 12 Aug 2010
Posts: 678
|
| Post: #1608 Posted: Mon Apr 30, 2012 9:18 am Post subject: |
|
|
Continuous future charts are well accepted norm of charting industry.
My personal view is one should trade whats visible on the chart.
Regards
|
|
| Back to top |
|
|
traderindian
White Belt
Joined: 03 Apr 2010
Posts: 56
|
| Post: #1609 Posted: Mon Apr 30, 2012 9:28 pm Post subject: |
|
|
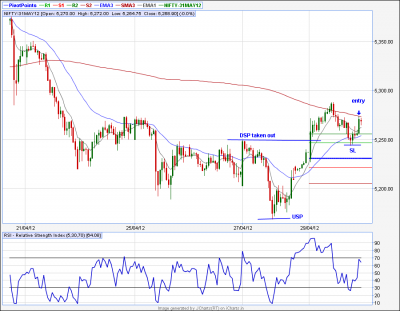
Trend change after the breach of 5250 DSP.. Nifty long in 15 min TF..
USP at 5168..
|
|
| Back to top |
|
|
amitkbaid1008
Yellow Belt
Joined: 04 Mar 2009
Posts: 540
|
| Post: #1610 Posted: Mon Apr 30, 2012 10:39 pm Post subject: |
|
|
| traderindian wrote: | Trend change after the breach of 5250 DSP.. Nifty long in 15 min TF..
USP at 5168.. |
Entry @ 5270 ??
|
|
| Back to top |
|
|
sonila
Brown Belt

Joined: 04 Jun 2009
Posts: 1786
|
| Post: #1611 Posted: Tue May 01, 2012 9:05 am Post subject: |
|
|
| Traderindian, plz post the chart showing new usp 5168.
|
|
| Back to top |
|
|
ReD.om
White Belt
Joined: 19 Jun 2011
Posts: 1
|
| Post: #1612 Posted: Tue May 01, 2012 10:37 am Post subject: |
|
|
Trend change with new USP 5169.
Any correction welcomed...!!
| Description: |
|
| Filesize: |
42.28 KB |
| Viewed: |
462 Time(s) |
|
|
|
| Back to top |
|
|
traderindian
White Belt
Joined: 03 Apr 2010
Posts: 56
|
| Post: #1613 Posted: Tue May 01, 2012 7:41 pm Post subject: |
|
|
| amitkbaid1008 wrote: | | traderindian wrote: | Trend change after the breach of 5250 DSP.. Nifty long in 15 min TF..
USP at 5168.. |
Entry @ 5270 ?? |
Hello Amit,
Entry is taken as soon as the DSP/USP is breached..Just one tick above or below is enuf for trend change.. we dont wait for candle close..
|
|
| Back to top |
|
|
traderindian
White Belt
Joined: 03 Apr 2010
Posts: 56
|
| Post: #1614 Posted: Tue May 01, 2012 7:50 pm Post subject: |
|
|
| ReD.om wrote: | Trend change with new USP 5169.
Any correction welcomed...!! |
Thanks Red for posting the charts...I dont have proper charts as yet.. 
|
|
| Back to top |
|
|
Arjun20
Yellow Belt
Joined: 23 Jun 2011
Posts: 945
|
| Post: #1615 Posted: Wed May 02, 2012 8:55 am Post subject: |
|
|
| traderindian wrote: |
Hello Amit,
Entry is taken as soon as the DSP/USP is breached....???
Just one tick above or below is enuf for trend change.. we dont wait for candle close..RIGHT |
Hi TI,
Pls visit SSPS theory for details. It's not rule that you should jump into trade as soon as pivot is broken. At times,you have to wait for opportunity if Stop is far away.
|
|
| Back to top |
|
|
prabit
White Belt
Joined: 02 Jul 2009
Posts: 133
|
| Post: #1616 Posted: Wed May 02, 2012 9:11 am Post subject: |
|
|
| ReD.om wrote: | Trend change with new USP 5169.
Any correction welcomed...!! |
Hi ReD, thanks for the chart. Pl mention timeframe and what are the emas
|
|
| Back to top |
|
|
SAKLECHA
White Belt
Joined: 26 Jan 2010
Posts: 333
|
| Post: #1617 Posted: Wed May 02, 2012 9:23 am Post subject: |
|
|
Buy at/above 5310.76 Targets: 5326.33 5344.59 5362.87 5381.19 5399.54
Sell at/below: 5292.56 Targets: 5277.02 5258.87 5240.75 5222.67 5204.61
|
|
| Back to top |
|
|
amit0666
White Belt
Joined: 23 Jun 2010
Posts: 86
|
| Post: #1618 Posted: Wed May 02, 2012 10:15 am Post subject: |
|
|
| nifty future usp is 5244.15 plz correct me if i am wrong
|
|
| Back to top |
|
|
ashis
White Belt
Joined: 28 Mar 2010
Posts: 75
|
| Post: #1619 Posted: Wed May 02, 2012 11:04 am Post subject: |
|
|
Dear Saklecha,
Thanks for posting.
Can you explain which theory you used for this kind of TGTS & SL ?
If you explain than it is useful for other fellow trades.
Till today in this thrade Speculator sir / Jaii sir or any other expert didn't give this kind of things in advance. '
So requesting you to explain your view for this kind of theory in brief.
Hope you will explain properly.
Regards
Ashis
| SAKLECHA wrote: | Buy at/above 5310.76 Targets: 5326.33 5344.59 5362.87 5381.19 5399.54
Sell at/below: 5292.56 Targets: 5277.02 5258.87 5240.75 5222.67 5204.61 |
|
|
| Back to top |
|
|
SAKLECHA
White Belt
Joined: 26 Jan 2010
Posts: 333
|
|
| Back to top |
|
|
|


