| View previous topic :: View next topic |
| Author |
Swing Trading : The Speculator way |
Speculator
Expert

Joined: 15 Apr 2008
Posts: 149
|
Post: #166  Posted: Sun Jun 06, 2010 8:46 am Post subject: Posted: Sun Jun 06, 2010 8:46 am Post subject: |
 |
|
smsmss,
Again, nothing new on that setup. It's bullish rejection from 13 ema on 60-min. I explained the setup in my May 18 post in detail.
RSI getting overbought and price not making new highs is in itself not a sign of weakness. RSI should get overbought and turn down below 70 and the price should fail to make new highs, which qualifies as weakness. Anyway, entering after a big gap-up was not a good idea. Setups have to be taken at the trigger point. If you don't, then wait for next setup. Chasing prices will only lead to whipsaw.
The selloff in U.S markets on friday will no doubt trigger a big gap-down on Nifty on Monday. If we hold above the swing pivot at 4933.50 and turn up, then it's time to buy again or add to existing positions. Otherwise, it's time to start positioning for the next downleg.
-Speculator
|
|
| Back to top |
|
 |
|
|
 |
smsmss
White Belt

Joined: 13 Oct 2009
Posts: 123
|
Post: #167  Posted: Wed Jun 09, 2010 1:40 am Post subject: hello all. Posted: Wed Jun 09, 2010 1:40 am Post subject: hello all. |
 |
|
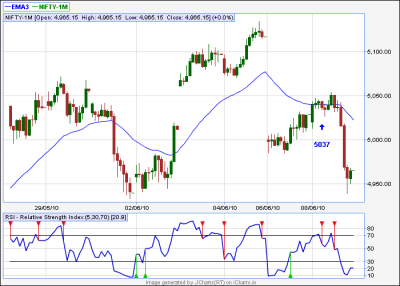
today closed my longs at 5037 and went for some intra shorts as the RSI became overbought and came down without making any highs. not much loss only of 35 points and also my hedged position quite helped.Swing pivot still holds which is 4933.Nifty is very volatile and swing stop loss is roughly around 150 points or more every time.a bounce is expected tomorrow. Spec i have seen in such a situation where market is weak in the initial phases of a trend a swing position can be taken when the market takes out the previous trend's last swing pivot, which in this case is 5023, of the downtrend. (if the trader is aggressive.) Spec ur comments are welcome.
| Description: |
|
| Filesize: |
21.01 KB |
| Viewed: |
562 Time(s) |
|
|
|
| Back to top |
|
 |
Speculator
Expert

Joined: 15 Apr 2008
Posts: 149
|
Post: #168  Posted: Wed Jun 09, 2010 8:36 am Post subject: RSI failure Posted: Wed Jun 09, 2010 8:36 am Post subject: RSI failure |
 |
|
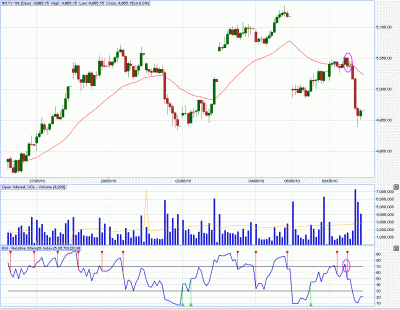
Today we had a RSI failure (RSI gets OB and turns down below 70 without price making new highs), which was a signal to close longs. Subsequent rejection from 34 ema was a signal to go short intraday. Swing pivot at 4933 is still intact for now.
| Description: |
|
| Filesize: |
45.51 KB |
| Viewed: |
662 Time(s) |
|
|
|
| Back to top |
|
 |
Speculator
Expert

Joined: 15 Apr 2008
Posts: 149
|
Post: #169  Posted: Thu Jun 10, 2010 8:48 am Post subject: Bad whipsaw day Posted: Thu Jun 10, 2010 8:48 am Post subject: Bad whipsaw day |
 |
|
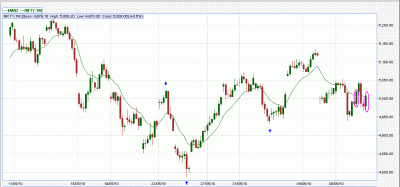
The upswing pivot is still intact. But overall it was a bad whipsaw day on my system. The 60-min gave a buy (circled in red), which got stopped out. It appeared like a daytrade sell after that on the 30-min charts (RSI failure), which was also stopped out. At the close the 60-min gave another buy signal (second red circle). This kind of confusion and compression happens before a big move occurs. Be on watchout for a big move in the next 1-2 days.
- Naveen Swamy
| Description: |
|
| Filesize: |
28.72 KB |
| Viewed: |
645 Time(s) |
|
|
|
| Back to top |
|
 |
Speculator
Expert

Joined: 15 Apr 2008
Posts: 149
|
|
| Back to top |
|
 |
smsmss
White Belt

Joined: 13 Oct 2009
Posts: 123
|
Post: #171  Posted: Fri Jun 11, 2010 2:52 am Post subject: query Posted: Fri Jun 11, 2010 2:52 am Post subject: query |
 |
|
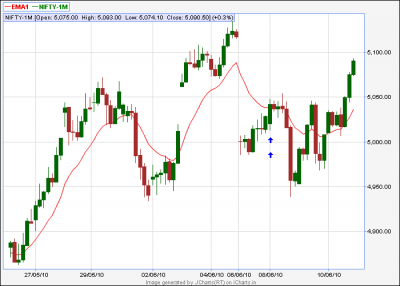
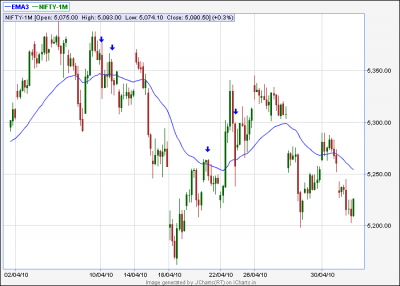
Hi Spec, are these whipsaws in type 2 reversals in 60 min TF?...i have attached the 2 charts one of downtrend and one of the new uptrend.If these are not whipsaws kindly explain why and if they are then plz explain how to tackle stop loss in these.
| Description: |
|
| Filesize: |
14.79 KB |
| Viewed: |
601 Time(s) |
|
| Description: |
|
| Filesize: |
13.43 KB |
| Viewed: |
591 Time(s) |
|
|
|
| Back to top |
|
 |
Speculator
Expert

Joined: 15 Apr 2008
Posts: 149
|
Post: #172  Posted: Mon Jun 14, 2010 8:55 am Post subject: Posted: Mon Jun 14, 2010 8:55 am Post subject: |
 |
|
smsmss,
Some of the signals you have shown on the chart were stopped out, without a question. They were legitimate signals and had to be traded. When trading the 60-min charts, you place the SL above(for shorts)/below(for longs) the candle which triggers the signal. Typically out of 10 trades, you get about 3-4 stopouts. If you use a 30-40 point SL and 80-100 point profit objective, then you will come out with flying colors, if you take all the signals. The goal is not to avoid all losses. The goal is to make more on your winners than your losers. At least 2:1 risk/reward is the play you should go for.
-Speculator.
|
|
| Back to top |
|
 |
smsmss
White Belt

Joined: 13 Oct 2009
Posts: 123
|
Post: #173  Posted: Mon Jun 14, 2010 8:40 pm Post subject: Posted: Mon Jun 14, 2010 8:40 pm Post subject: |
 |
|
Nicely explained Spec, Thanx like always.   
|
|
| Back to top |
|
 |
Speculator
Expert

Joined: 15 Apr 2008
Posts: 149
|
Post: #174  Posted: Thu Jun 17, 2010 4:07 pm Post subject: Posted: Thu Jun 17, 2010 4:07 pm Post subject: |
 |
|
As i posted on June 10, the whipsaw and compression was a precursor to a big move coming. Well, we did get a huge move of nearly 290 points from where the hourly buy signal was triggered. Market is way overbought and we have some glaring divergences on 60-min. It's prudent to book profits on remaining positions and wait for a pullback to reenter.
Swing pivot on 60-min remains at 4939.
- Speculator 
|
|
| Back to top |
|
 |
optimist
White Belt

Joined: 06 May 2010
Posts: 18
|
Post: #175  Posted: Fri Jun 18, 2010 7:20 pm Post subject: Posted: Fri Jun 18, 2010 7:20 pm Post subject: |
 |
|
Hi Spec,
I know that an entry point for your method is when RSI is below 20 and then Nifty trades below 34 EMA and closes below it.
But there is a confirmation only after it breaks the previous swing low.
Do you suggest entering into the trade after Nifty hits swing high/low or entering anytime when Nifty closed below 34 EMA and satisifies RSI conditions ???
I feel there are more whipsaws when trading using 34 EMA close method than entering using "Swing hig/low" method.
Please throw your view on this
|
|
| Back to top |
|
 |
varun_alld
White Belt

Joined: 14 Dec 2009
Posts: 25
|
Post: #176  Posted: Mon Jun 21, 2010 11:31 am Post subject: One question ???? Posted: Mon Jun 21, 2010 11:31 am Post subject: One question ???? |
 |
|
i have been a regular visitor of this FORUM-Swing trading- the spec way
just could not understand one thing?
how do we decide weather we would go for 15 minute timeframe, a 30 minute time frame or a 60minute time frame to generate buy and sell calls ????
how do we decide on this ????? does this comes with experince or there is some way for this as well??
|
|
| Back to top |
|
 |
Speculator
Expert

Joined: 15 Apr 2008
Posts: 149
|
Post: #177  Posted: Mon Jun 21, 2010 12:00 pm Post subject: Posted: Mon Jun 21, 2010 12:00 pm Post subject: |
 |
|
Optimist/Varun,
The amount of whipsaws is directly proportional to the timeframe traded in my experience. The higher the timeframe, the lower the whipsaw, but larger the SL required. 60 min will no doubt have less whipsaws than 30-min which will have less whipsaws than 15-min and so on. But the size of the SL required increases with timeframe. With current levels of volatiltity, one can manage with a 8-10 SL on 5-min, 10-20 point SL on 15-min, 20-40 point SL on 30-min, 30-60 point SL on 60-min. Overall, if one considers the number of stopsouts and the size of SL, the losses work out pretty much the same. So one has to choose the timeframe, what is psychologically comfortable for them.
For me, i don't like too many stopouts, which is my personal preference. But i am comfortable with wide stops (30-60 points). So i choose either 30-min or 60-min. Last year i exclusively traded the 15-min charts, as the range of the market was pretty good. Varun, to answer your question, choose the highest timeframe for which you can afford the required SL.
|
|
| Back to top |
|
 |
varun_alld
White Belt

Joined: 14 Dec 2009
Posts: 25
|
Post: #178  Posted: Mon Jun 21, 2010 2:39 pm Post subject: Thanks speckyy !!!! Posted: Mon Jun 21, 2010 2:39 pm Post subject: Thanks speckyy !!!! |
 |
|
Thanks for the reply Specky....
You said that last year the range was pretty good so you followed 15 minute Time Frame .... now how do we decide that the range is good or bad???
|
|
| Back to top |
|
 |
Speculator
Expert

Joined: 15 Apr 2008
Posts: 149
|
Post: #179  Posted: Tue Jun 22, 2010 8:34 am Post subject: Posted: Tue Jun 22, 2010 8:34 am Post subject: |
 |
|
Varun,
Choose the highest timeframe for which you can afford the required SL.
Last year, using my methods i had to use 30-50 points SL for 15-min. Whereas the hourly required anywhere between 60-120 points which i could not afford. There were hourly bars, which were many times 100+ points wide. Which means trading hourly was out of question, given the SL that i could afford, which is max 60 points.
This year, the volatility has dropped. The signal triggering candle on the hourly has been in the 40-60 point range this year. So i choose to trade with the hourly.
|
|
| Back to top |
|
 |
sandew
White Belt

Joined: 02 Feb 2009
Posts: 174
|
Post: #180  Posted: Tue Jun 22, 2010 10:31 am Post subject: Hi Posted: Tue Jun 22, 2010 10:31 am Post subject: Hi |
 |
|
Spec, are you still maintaining 4933 as Swing Pivot or shifted it up to 5250 now. (after the 100 point gap up yesterday), (cmp 5350 June 22).
Thank You
|
|
| Back to top |
|
 |
|

