| View previous topic :: View next topic |
| Author |
Swing Trading : The Speculator way |
smartcancerian
Yellow Belt

Joined: 07 Apr 2010
Posts: 542
|
Post: #211  Posted: Thu Oct 07, 2010 7:22 pm Post subject: Posted: Thu Oct 07, 2010 7:22 pm Post subject: |
 |
|
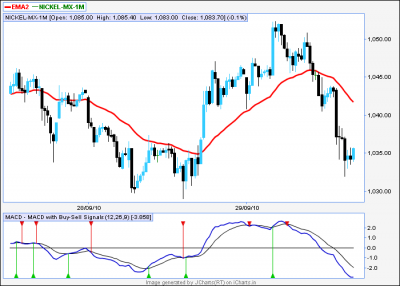
Spec sir..I am attaching nickel 15 mint chart with 34 ema..pl help me to identify..entry/exits..with pivots...this will help me to clear sum of my doubts..i shall b very thankful for your valuable time spared for me..pl repost the marked chart in forum...thanx sir
| Description: |
|
| Filesize: |
17.82 KB |
| Viewed: |
458 Time(s) |
|
|
|
| Back to top |
|
 |
|
|
 |
Speculator
Expert

Joined: 15 Apr 2008
Posts: 149
|
Post: #212  Posted: Thu Oct 07, 2010 8:08 pm Post subject: Posted: Thu Oct 07, 2010 8:08 pm Post subject: |
 |
|
Smart,
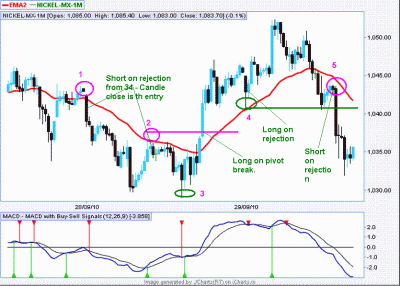
1 and 2 are downswing pivots caused by rejection from 34 EMA. Entry is on the candle close of rejection candle, which i have marked in the image. SL should be above the swing highs ( above Pivot 1/pivot 2).
Once price moved above pivot 2, the trend turns up. 3 and 4 are upswing pivots. You could use the pivot break to enter the long trade, but would require a wide SL. Alternately, you could enter long at rejection from 34 at pivot 4.
Once we break below 4, we enter a downtrend. You could use the pivot break to enter short, but would require large SL again. Or you could short on rejection from 34 at pivot 5.
Exit rules are simple:
Book half profits on predetermined profit target like 1:2 or 1:3 risk reward. Rest half on trend change or some huge risk/reward like 1:6 or above.
- Good luck !
| Description: |
|
| Filesize: |
42.63 KB |
| Viewed: |
689 Time(s) |
|
|
|
| Back to top |
|
 |
Speculator
Expert

Joined: 15 Apr 2008
Posts: 149
|
Post: #213  Posted: Thu Oct 07, 2010 8:14 pm Post subject: Posted: Thu Oct 07, 2010 8:14 pm Post subject: |
 |
|
girishhu1,
Answer to your questions are similar to that of what i have given to Smart below. Your SL should be above the pivot. Partial profits should be taken on your short and the rest carried forward.
|
|
| Back to top |
|
 |
girishhu1
White Belt

Joined: 17 Aug 2009
Posts: 316
|
Post: #214  Posted: Thu Oct 07, 2010 8:54 pm Post subject: Posted: Thu Oct 07, 2010 8:54 pm Post subject: |
 |
|
thanks for reply.

|
|
| Back to top |
|
 |
smartcancerian
Yellow Belt

Joined: 07 Apr 2010
Posts: 542
|
Post: #215  Posted: Fri Oct 08, 2010 9:11 am Post subject: Posted: Fri Oct 08, 2010 9:11 am Post subject: |
 |
|
| Thanx again..very nicely explained..
|
|
| Back to top |
|
 |
girishhu1
White Belt

Joined: 17 Aug 2009
Posts: 316
|
Post: #216  Posted: Fri Oct 08, 2010 8:49 pm Post subject: Posted: Fri Oct 08, 2010 8:49 pm Post subject: |
 |
|
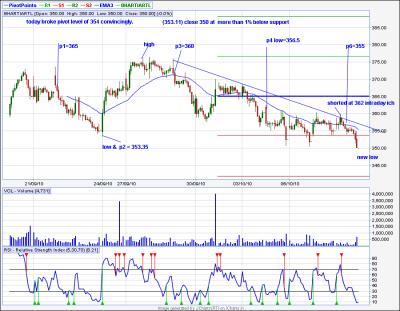
i am enclosing a chart of bharti airtel with pivots marked. Seniors are requested to guide how to carry forward the trade.i have started using this method recently and hence need some guidance.specji/shekharji, please if u can spare some time.
| Description: |
|
| Filesize: |
40.59 KB |
| Viewed: |
585 Time(s) |
|
|
|
| Back to top |
|
 |
Speculator
Expert

Joined: 15 Apr 2008
Posts: 149
|
|
| Back to top |
|
 |
shekharinvest
Yellow Belt

Joined: 21 Dec 2007
Posts: 549
|
Post: #218  Posted: Mon Nov 29, 2010 7:16 pm Post subject: Posted: Mon Nov 29, 2010 7:16 pm Post subject: |
 |
|
Hi !
Is another round of selling coming ?
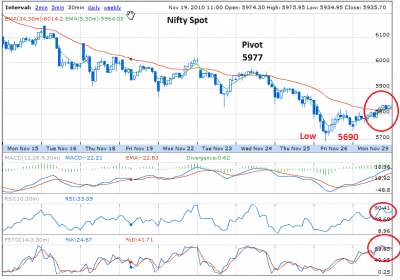
Trend is still down and the pivot is at 5977 and the low of the current rally is 5690.
Today price has risen to the 34 ema and placed just over it. We need a 30 min candle close below 34 ema and below the low of previous candle.
One can go short if we get a 30 min candle close below 5815 with SL 5836 as of now. All the indicators are approaching overbought levels, indicative of -'soon coming to an end' of the counter trend rally. (We are not into prediction, wait for the signal!)
Please note all the levels are Nifty Spot.
SHEKHAR
| Description: |
|
| Filesize: |
65.24 KB |
| Viewed: |
580 Time(s) |
|
|
|
| Back to top |
|
 |
ashokrajan
White Belt

Joined: 06 Sep 2010
Posts: 8
|
Post: #219  Posted: Tue Nov 30, 2010 6:12 am Post subject: Posted: Tue Nov 30, 2010 6:12 am Post subject: |
 |
|
Hi Shekar,
Nice to see the charts. But i can see 30 min charts for only 3 days. And am using Icharts Basic Version.
Are you using the same one?
Pls clarify....
Thanks,
Ashok
|
|
| Back to top |
|
 |
kamal.icharts
Site Admin
Joined: 10 Apr 2013
Posts: 576
|
Post: #220  Posted: Tue Nov 30, 2010 9:39 am Post subject: Posted: Tue Nov 30, 2010 9:39 am Post subject: |
 |
|
Hi Ashok,
By default, the chart will diaplay 3 days of data. You can increase the number of days to around 20-30 during market hours. Please refer to Page 5/6 of the Help file in order to understand how to change the timeframe settings.
| ashokrajan wrote: | Hi Shekar,
Nice to see the charts. But i can see 30 min charts for only 3 days. And am using Icharts Basic Version.
Are you using the same one?
Pls clarify....
Thanks,
Ashok |
|
|
| Back to top |
|
 |
vinst
Black Belt

Joined: 09 Jan 2007
Posts: 3303
|
Post: #221  Posted: Mon Dec 06, 2010 8:52 pm Post subject: Posted: Mon Dec 06, 2010 8:52 pm Post subject: |
 |
|
Hello Shekhar / Speculator,
Is NF low of 3-Dec (5972) now the reversal point for NF longs on 30min time frame?
Sorry, I do not have chart avlbl with me this time.
regards
vin
|
|
| Back to top |
|
 |
sherbaaz
Yellow Belt

Joined: 27 May 2009
Posts: 543
|
Post: #222  Posted: Tue Dec 07, 2010 5:22 pm Post subject: Posted: Tue Dec 07, 2010 5:22 pm Post subject: |
 |
|
Hi Spec/all,
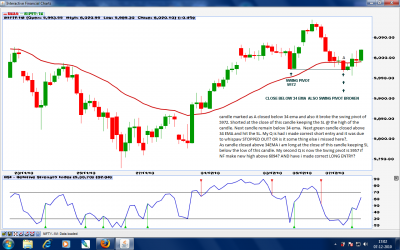
I am attaching NF chart 60 minute TF as per this method I have mentioned my 2 trades on the chart need your inputs on the same. As recently I have started using this method I am not sure whether I have made the right trades as per the method.
I am using 60 min TF with 34 EMA. Kindly clarify can 60 min tf be used with 34 EMA as most of the people are using 30 min tf chart (posted here)
Regards,
| Description: |
|
| Filesize: |
151.01 KB |
| Viewed: |
646 Time(s) |
|
|
|
| Back to top |
|
 |
shekharinvest
Yellow Belt

Joined: 21 Dec 2007
Posts: 549
|
Post: #223  Posted: Wed Dec 08, 2010 4:41 pm Post subject: Posted: Wed Dec 08, 2010 4:41 pm Post subject: |
 |
|
Hi,
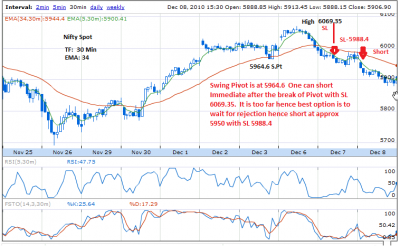
Sherbaaz, Yes you can use any time frame for this method you simply need to choose EMA which best suits the time frame and the security being traded.
Vinst, you seems to be right, as 5964.4 NS is the Swing pivot for shorts.
I don't have access to NF charts as of now. The charts I have access to is being attached with current actions marked on it.
Hope it helps.
SHEKHAR
| Description: |
|
| Filesize: |
62.37 KB |
| Viewed: |
628 Time(s) |
|
|
|
| Back to top |
|
 |
vinst
Black Belt

Joined: 09 Jan 2007
Posts: 3303
|
Post: #224  Posted: Wed Dec 08, 2010 5:05 pm Post subject: Posted: Wed Dec 08, 2010 5:05 pm Post subject: |
 |
|
Hi Shekhar,
thanks for your opinion.
regards
vin
|
|
| Back to top |
|
 |
sherbaaz
Yellow Belt

Joined: 27 May 2009
Posts: 543
|
Post: #225  Posted: Thu Dec 09, 2010 11:15 am Post subject: Posted: Thu Dec 09, 2010 11:15 am Post subject: |
 |
|
| shekharinvest wrote: | Hi,
Sherbaaz, Yes you can use any time frame for this method you simply need to choose EMA which best suits the time frame and the security being traded.
Vinst, you seems to be right, as 5964.4 NS is the Swing pivot for shorts.
I don't have access to NF charts as of now. The charts I have access to is being attached with current actions marked on it.
Hope it helps.
SHEKHAR |
Hi,
Shekhar thanks for your inputs I request if u can look at the chart i attached along with my post I have certain queries if u can chk it it would a great help.
Regards,
|
|
| Back to top |
|
 |
|

