| View previous topic :: View next topic |
| Author |
Swing Trading : The Speculator way |
sanmen
White Belt

Joined: 28 Apr 2008
Posts: 88
Location: Delhi
|
Post: #2251  Posted: Fri Apr 26, 2013 8:03 am Post subject: Posted: Fri Apr 26, 2013 8:03 am Post subject: |
 |
|
Hi Smart
5861 is the USP as per the April contract. however, the NF May charts suggest USP as 5810. I understand this is due to the expiry and change of contract.
What do you suggest we follow in this case? Is it better to follow the continuous charts which would mean USP is 5861 itself.
Sandeep
|
|
| Back to top |
|
 |
|
|
|
smartcancerian
Yellow Belt

Joined: 07 Apr 2010
Posts: 542
|
| Post: #2252 Posted: Fri Apr 26, 2013 8:53 am Post subject: |
|
|
| @ Sanmen..personally..i follow expiry charts...so as per that charts, you are right..usp is far away..bt looking/consulting nifty spot chart is also a good idea for next 2-3 sessions..(whatever you follow, follow it consistently..everytime it can't be wrong-as Veeru anna says)
|
|
| Back to top |
|
|
bharatpatel
White Belt
Joined: 26 Oct 2011
Posts: 401
|
| Post: #2253 Posted: Fri May 03, 2013 9:38 pm Post subject: hi |
|
|
Are bhai sab log kaha kho gaye ?
pls post updates with chart.
Bharat.
|
|
| Back to top |
|
|
smartcancerian
Yellow Belt
Joined: 07 Apr 2010
Posts: 542
|
| Post: #2254 Posted: Wed May 08, 2013 2:39 pm Post subject: |
|
|
| latest USP is 6025.30
|
|
| Back to top |
|
|
bharatpatel
White Belt
Joined: 26 Oct 2011
Posts: 401
|
| Post: #2255 Posted: Fri May 10, 2013 3:30 pm Post subject: hi |
|
|
nice up move got using s s p s 15 tf 30 tf combination
I don't think any other set up can give this kind of signals and a trade can be managed with proper stop loss like we do using S S P S.
Hats off Mr. Speculator.
Dear smart,
pls post chart along with notes.
|
|
| Back to top |
|
|
smartcancerian
Yellow Belt
Joined: 07 Apr 2010
Posts: 542
|
| Post: #2256 Posted: Sun May 12, 2013 7:36 am Post subject: |
|
|
Bharat, why don't you give a try to post the chart, let it be wrong, it will a better way to learn & check your understanding...  ...Post the chart, waiting.. ...Post the chart, waiting..
|
|
| Back to top |
|
|
bharatpatel
White Belt
Joined: 26 Oct 2011
Posts: 401
|
|
| Back to top |
|
|
bharatpatel
White Belt
Joined: 26 Oct 2011
Posts: 401
|
| Post: #2258 Posted: Sun May 12, 2013 5:47 pm Post subject: hi |
|
|
Dear Smart,
Edited with charts.
pls have a look
waiting for yr comments.
|
|
| Back to top |
|
|
smartcancerian
Yellow Belt
Joined: 07 Apr 2010
Posts: 542
|
| Post: #2259 Posted: Sun May 12, 2013 5:51 pm Post subject: |
|
|
chart..

|
|
| Back to top |
|
|
smartcancerian
Yellow Belt
Joined: 07 Apr 2010
Posts: 542
|
| Post: #2260 Posted: Sun May 12, 2013 5:58 pm Post subject: |
|
|
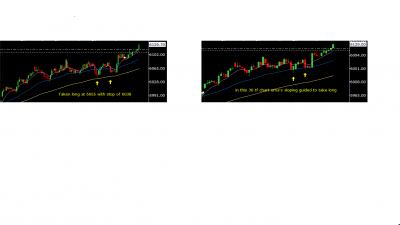
| long is above 12.45 candle @ 6079..sl is 6038..
|
|
| Back to top |
|
|
bharatpatel
White Belt
Joined: 26 Oct 2011
Posts: 401
|
| Post: #2261 Posted: Mon May 13, 2013 10:19 am Post subject: hi |
|
|
Dear Smart,
It was a going long set up as per 9:45 candle.
The 9:30 a.m. candle (10/05/13) closed above 8 and 34 ema plus 8ema was rising with that candle plus 9:45 candle closed above 9:30 candle high.
I thought it was confirmed to go long near usp.
Markings on yr chart itself explains clearly.
I tried to clarify why i went long and what was my thinking for that.
i hope it will be the best learning phase if you support me like this.
Actually i know S S P S and using with some modifications but now i want to learn it in most basic form as Spec sir have put here.
|
|
| Back to top |
|
|
bharatpatel
White Belt
Joined: 26 Oct 2011
Posts: 401
|
| Post: #2262 Posted: Mon May 13, 2013 10:36 am Post subject: |
|
|
| smartcancerian wrote: | chart..
|
Dear Smart,
Trying my skill on your posted chart.
1. 6070 taken and high made 6090 so 6025 became U S P
2. 6090 taken so 6038 is U S P.
3. if market failed to cross 6090 then 6025 is our U S P and 6038 would have marked as LOW and after breaking 6025 6070 would have been marked as D S P
Is my thinking correct ?
Bharat.
|
|
| Back to top |
|
|
EssJay
White Belt
Joined: 05 Sep 2012
Posts: 270
|
| Post: #2263 Posted: Mon May 13, 2013 11:13 am Post subject: |
|
|
| smartcancerian wrote: | | long is above 12.45 candle @ 6079..sl is 6038.. |
Hi smart,
This is for my understanding only. Suppose the USP breaks, then tectonically, the up love is over? How do we trade that? Wait for nifty to move up and trade rejection from 34 ema with 6129 as SL?
Thanks.
|
|
| Back to top |
|
|
smartcancerian
Yellow Belt
Joined: 07 Apr 2010
Posts: 542
|
| Post: #2264 Posted: Mon May 13, 2013 12:59 pm Post subject: |
|
|
| EssJay wrote: | | smartcancerian wrote: | | long is above 12.45 candle @ 6079..sl is 6038.. |
Hi smart,
This is for my understanding only. Suppose the USP breaks, then tectonically, the up love is over? How do we trade that? Wait for nifty to move up and trade rejection from 34 ema with 6129 as SL?
Thanks. |
That shall the safest way as per the method- Selling at pullback/rejection
|
|
| Back to top |
|
|
bharatpatel
White Belt
Joined: 26 Oct 2011
Posts: 401
|
| Post: #2265 Posted: Mon May 13, 2013 1:20 pm Post subject: hi |
|
|
| U S P Taken.
|
|
| Back to top |
|
|
|