|
|
| View previous topic :: View next topic |
| Author |
Swing Trading : The Speculator way |
mariner
White Belt

Joined: 06 Nov 2009
Posts: 17
|
Post: #241  Posted: Thu Jan 06, 2011 11:56 am Post subject: Posted: Thu Jan 06, 2011 11:56 am Post subject: |
 |
|
spec sir/ shekar sir
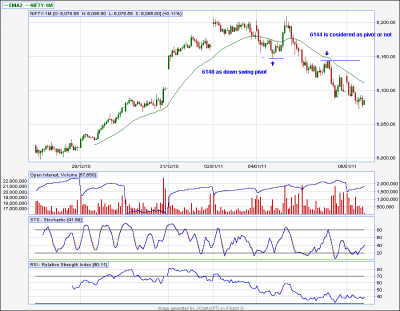
plz see the attached nf chart. I have one doubt for current downtrend does 6144 considered as up swing pivot or not ?
tnxs
Mariner
| Description: |
|
| Filesize: |
21.8 KB |
| Viewed: |
604 Time(s) |
|
|
|
| Back to top |
|
 |
|
|  |
shekharinvest
Yellow Belt

Joined: 21 Dec 2007
Posts: 549
|
Post: #242  Posted: Thu Jan 06, 2011 6:59 pm Post subject: Posted: Thu Jan 06, 2011 6:59 pm Post subject: |
 |
|
| mariner wrote: | spec sir/ shekar sir
plz see the attached nf chart. I have one doubt for current downtrend does 6144 considered as up swing pivot or not ?
tnxs
Mariner |
Mariner,
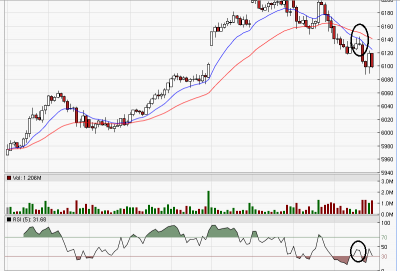
No. Swing pivot is still at 6209.
When price is quite close to 34 EMA it becomes a bit iffy ? How close is close enough. But I have broadly outlined how to infer. Yet it is all subjective.
Please see the chart attached.
1. Price has failed give a reasonable retracement. It is far off from 34 ema. In fact, it has failed to give a closing above 13 ema.
2. Have a look at the RSI it has not come closer to the OB (70-90) condition. It is yet to move above 50.
Both the above condition suggests that the above retracement is not sufficient and we can not call 6144 as Swing pivot.
The above analysis is based on 34 EMA and 30 Min TF.
Your chart seems to be of different TF and if you are trading that TF you can have your own views.
SHEKHAR
| Description: |
|
| Filesize: |
37.73 KB |
| Viewed: |
534 Time(s) |
|
|
|
| Back to top |
|
 |
Speculator
Expert

Joined: 15 Apr 2008
Posts: 149
|
Post: #243  Posted: Thu Jan 06, 2011 7:01 pm Post subject: Posted: Thu Jan 06, 2011 7:01 pm Post subject: |
 |
|
I had not visited this thread for a long time, as i treat the "Swing trading" method as a completed project. Honestly there is nothing more to add or teach, other than the techniques discussed. For those interested, application in real-time is the only way to learn. For any doubts, you can contact me on shout-box after the market hours, if you have any doubts.
Shekar,
Happy new year to you as well !
Mariner,
Yes 6144 is a valid downswing pivot on 15-min TF. On the 30-min and 60-min we don't have any downswing pivots established yet.
Jai,
I am really glad that you are able to use the method successfully and make money. Congrats !!
Last edited by Speculator on Thu Jan 06, 2011 7:17 pm; edited 1 time in total |
|
| Back to top |
|
 |
Speculator
Expert

Joined: 15 Apr 2008
Posts: 149
|
Post: #244  Posted: Thu Jan 06, 2011 7:06 pm Post subject: Posted: Thu Jan 06, 2011 7:06 pm Post subject: |
 |
|
Shekar,
I just read your reply to mariner. The RSI not getting overbought is an excellent point you make. When the RSI(5) gets overbought and a rejection, happens, it a solid indication of a pivot without any ambiguity. Although, i must say it is strictly not necessary according to the swing trading method. A touch of EMA and rejection is sufficient. However, when there is ambiguity, one can look at the RSI for additional confirmation.
|
|
| Back to top |
|
 |
shekharinvest
Yellow Belt

Joined: 21 Dec 2007
Posts: 549
|
Post: #245  Posted: Thu Jan 06, 2011 7:08 pm Post subject: Posted: Thu Jan 06, 2011 7:08 pm Post subject: |
 |
|
Hi Speculator,
Thanks for the warm wishes.
May this New year bring Happiness and Joy to you and your family !
Nice to see you on the forum.
SHEKHAR
|
|
| Back to top |
|
 |
mariner
White Belt

Joined: 06 Nov 2009
Posts: 17
|
Post: #246  Posted: Thu Jan 06, 2011 8:32 pm Post subject: Posted: Thu Jan 06, 2011 8:32 pm Post subject: |
 |
|
Thanxs Spec and Shekar sir for explaning.
Regards
Mariner
|
|
| Back to top |
|
 |
Speculator
Expert

Joined: 15 Apr 2008
Posts: 149
|
Post: #247  Posted: Tue Jan 18, 2011 8:57 am Post subject: Trading rejections Posted: Tue Jan 18, 2011 8:57 am Post subject: Trading rejections |
 |
|
Trading rejections
It's been more than an year since the "Swing trading the Speculator way" was posted. I still get basic questions in the shout-box such as "Is this a valid rejection ?". So i thought i will revisit this subject again.
Trading rejections is a way of trading with the trend. Rejections are based on the concept of mean reversion. Once a trend change occurs, the prices cross the 34 ema. Once this move gets overextended or overbought, a mean reversion to the neutral level occurs. 34 ema and 55 ema are generally the neutral levels on 15-min and 30-min timeframes. One can choose either 34 or 55 ema and both are equally valid. I personally use the 34 ema on both 15-min and 30-min timeframes for Nifty. Depending on the volatility of the stock and the timeframe, this neutral level can change. For instance on the 60-min timeframe, 13 ema happens to be the neutral level. I only trade 15-min and 30-min of Nifty generally. So let's focus on that.
Traders get anxious that they will miss a move, once a trend change occurs. But i would go to the extent of saying that a mean reversion to 34 ema "always" happens, except in some rare scenarios where a parabolic blowoff move occurs. Anyway trading parabolic blowoffs is a dangerous sport and rare occurrence, which does not merit out attention. So in a normal market environment, 34 ema acts a magnet pulling prices towards it after a trend gets overbought. Trading rejections is basically participating in the trend after a correction is over. The rules of rejection are very simple and unambigous
For a Bullish rejection, the stock/index is trading above the 34 ema, comes down either close to the 34 ema or touches the 34 ema or undershoots the 34 ema and reverses. For the rejection candle (trade entry candle) , the following rules must be satisfied:
1) Candle close should be above 34 ema
2) Candle close should be above the high of the prior candle.
3) 8 EMA should be rising (that is the 8 ema of the current candle should be higher than the 8 ema of the previous candle)
I added the rule #3 as a refinement (or filter) to avoid taking weak rejections. If 1) and 2) are satisifed and 3) is not satisfied, then it means the correction is still in progress.
For a Bearish rejection, the stock/index is trading below the 34 ema, comes up either close to the 34 ema or touches the 34 ema or overshoots the 34 ema and reverses. For the rejection candle (trade entry candle) , the following rules must be satisfied:
1) Candle close should be below 34 ema
2) Candle close should be below the low of the prior candle.
3) 8 EMA should be falling. (that is the 8 ema of the current candle should be lower than the 8 ema of the previous candle)
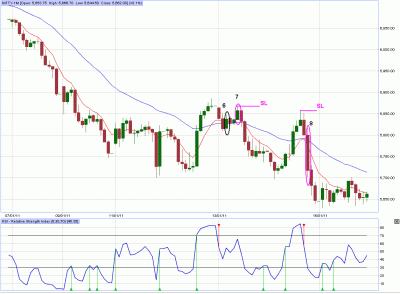
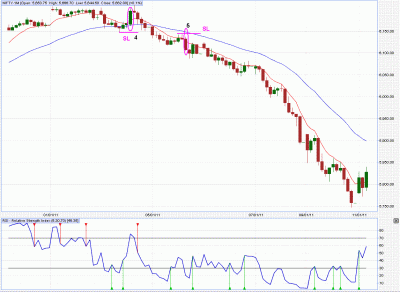
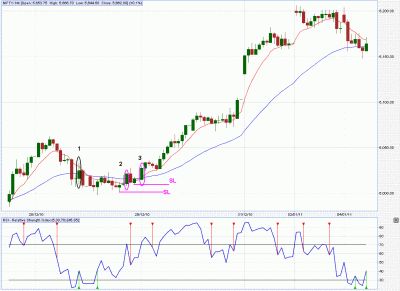
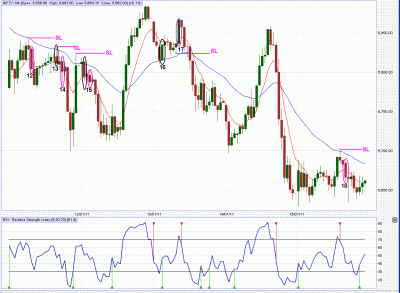
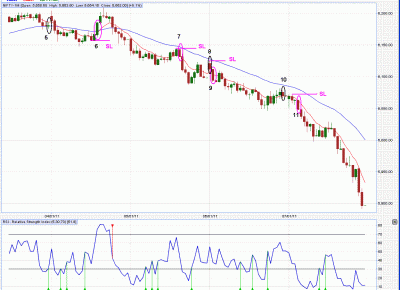
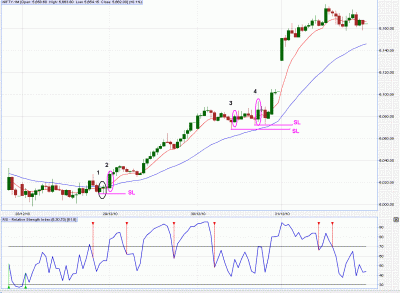
Here are some visual examples of rejections on both 15-min and 30-min charts which have occurred over the last few weeks. SL level for rejection is shown with a pink line and the valid rejection candles are shown in pink circles. Invalid rejections are shown in black circles.
15-min - nf1_15.gif, nf2_15.gif, nf3_15.gif
#1 - Invalid rejection. Rule 2) not satisfied.
#2,#3,#4 - Valid rejection. All rules satisfied.
#5 - Invalid rejection. Rule 2) not satisfied.
#6, #7 - Valid rejections
#8- Invalid rejection. Rule 2) not satisfied.
#9 - Valid rejection
#10 - Invalid rejection. Rule 2) not satisfied.
#11 - Valid rejection
#12,14,15,17,18 - valid rejections
#13 - Invalid rejection. Rule 2) not satisfied.
#16 - Invalid rejection. Rule 3) not satisfied.
If one had traded the valid rejections, most rejections made money except #6 and #17.
#6 occurred at the final stage of the trend, just before the trend reversal. But one has to take all the signals bcoz we never know for sure when the trend reverses.
#17 was a case of failed rejection.
So out of 12 valid rejections, there were only 2 failures. That's an 83% odds of success !
30-min - nf1_30.gif, nf2_30.gif, nf3_30.gif
#1 - Invalid rejection. Rule 3) not satisfied.
#2,#3, #4, #5 - Valid rejection. All rules satisfied.
#6 - Invalid rejection. Rule 2) not satisfied.
#7, #8 - valid rejection.
#8 although a valid rejection is hard to trade as the SL required is very huge. I would put that in the category of untraedable.
#7 is a case of rejection failure and would have lost money.
So out of 5 valid rejections, there was one failure - That's 80% odds of success !
- Speculator 
| Description: |
|
| Filesize: |
33.88 KB |
| Viewed: |
910 Time(s) |
|
| Description: |
|
| Filesize: |
36.49 KB |
| Viewed: |
736 Time(s) |
|
| Description: |
|
| Filesize: |
38.34 KB |
| Viewed: |
712 Time(s) |
|
| Description: |
|
| Filesize: |
50.51 KB |
| Viewed: |
728 Time(s) |
|
| Description: |
|
| Filesize: |
40.75 KB |
| Viewed: |
698 Time(s) |
|
| Description: |
|
| Filesize: |
37.65 KB |
| Viewed: |
741 Time(s) |
|
Last edited by Speculator on Mon Jun 20, 2011 11:54 am; edited 1 time in total |
|
| Back to top |
|
 |
vishytns
White Belt

Joined: 26 Nov 2009
Posts: 206
|
Post: #248  Posted: Tue Jan 18, 2011 10:48 am Post subject: Posted: Tue Jan 18, 2011 10:48 am Post subject: |
 |
|
Spec Sir,
Thanks alot for your article. It is really great. I will come back to you with some queries later.
regards
Vishy

|
|
| Back to top |
|
 |
vinst
Black Belt

Joined: 09 Jan 2007
Posts: 3303
|
Post: #249  Posted: Tue Jan 18, 2011 11:03 am Post subject: Posted: Tue Jan 18, 2011 11:03 am Post subject: |
 |
|
Hi Speculator,
Thanks really for a great summary with numerous useful examples.
regards
vin
|
|
| Back to top |
|
 |
casper
Green Belt

Joined: 02 Oct 2010
Posts: 1315
|
Post: #250  Posted: Tue Jan 18, 2011 11:55 am Post subject: Posted: Tue Jan 18, 2011 11:55 am Post subject: |
 |
|
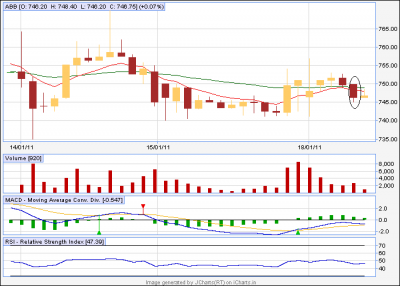
speculator sir
is it a valid rejection?
| Description: |
|
| Filesize: |
19.59 KB |
| Viewed: |
433 Time(s) |
|
|
|
| Back to top |
|
 |
smartcancerian
Yellow Belt

Joined: 07 Apr 2010
Posts: 542
|
Post: #251  Posted: Wed Jan 19, 2011 3:06 pm Post subject: Posted: Wed Jan 19, 2011 3:06 pm Post subject: |
 |
|
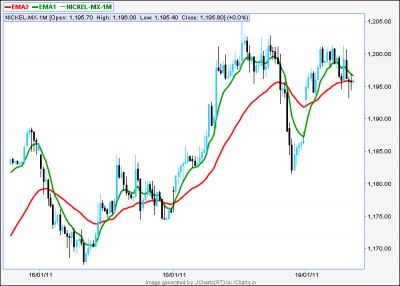
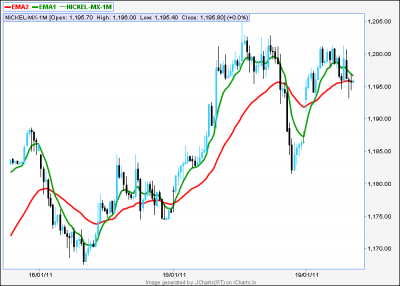
Sir , pl help to mark entry/exits & rejections on nickel 15 mint chart..emas on chart are 8 & 34..
| Description: |
|
| Filesize: |
21.24 KB |
| Viewed: |
439 Time(s) |
|
| Description: |
|
| Filesize: |
21.24 KB |
| Viewed: |
362 Time(s) |
|
|
|
| Back to top |
|
 |
smartcancerian
Yellow Belt

Joined: 07 Apr 2010
Posts: 542
|
Post: #252  Posted: Wed Jan 19, 2011 3:07 pm Post subject: Posted: Wed Jan 19, 2011 3:07 pm Post subject: |
 |
|
| sorry chart was attached twice
|
|
| Back to top |
|
 |
KillBull
White Belt

Joined: 03 Sep 2010
Posts: 2
|
Post: #253  Posted: Wed Jan 19, 2011 9:45 pm Post subject: Posted: Wed Jan 19, 2011 9:45 pm Post subject: |
 |
|
Thnaks Spec... whatever little i know of trading i know from your methods, posts and sb comments. Thanks much!!! 
|
|
| Back to top |
|
 |
ashis
White Belt

Joined: 28 Mar 2010
Posts: 75
|
Post: #254  Posted: Wed Jan 19, 2011 11:49 pm Post subject: Re: Trading rejections Posted: Wed Jan 19, 2011 11:49 pm Post subject: Re: Trading rejections |
 |
|
Dear sir,
Thanks for this good post. Which is good for study.
(1) I would like to know one thing that how can you decide stop loss? Is it at the time when in up trend candle gives whole body with shadow bellow 8-EMA? So can we consider low of this candle as stop loss? Or any thing else to decide stop loss? Please guide. I observe this thing in you NF-1 (15)
(2) Other question is that you've written in rule 2 that close of candle must be above the prior high.
You means that once O.B. happened then allow RSI come to near 50- or bellow that then once again when market pulls back at that time candle's close must be higher then previous high. Is right which I understand?
If market make new high in 2nd attempt but close of it is bellow then previous high then what?
Awaiting for you reply.
Thanks
Ashis
| Speculator wrote: | Trading rejections
It's been more than an year since the "Swing trading the Speculator way" was posted. I still get basic questions in the shout-box such as "Is this a valid rejection ?". So i thought i will revisit this subject again.
Trading rejections is a way of trading with the trend. Rejections are based on the concept of mean reversion. Once a trend change occurs, the prices cross the 34 ema. Once this move gets overextended or overbought, a mean reversion to the neutral level occurs. 34 ema and 55 ema are generally the neutral levels on 15-min and 30-min timeframes. One can choose either 34 or 55 ema and both are equally valid. I personally use the 34 ema on both 15-min and 30-min timeframes for Nifty. Depending on the volatility of the stock and the timeframe, this neutral level can change. For instance on the 60-min timeframe, 13 ema happens to be the neutral level. I only trade 15-min and 30-min of Nifty generally. So let's focus on that.
Traders get anxious that they will miss a move, once a trend change occurs. But i would go to the extent of saying that a mean reversion to 34 ema "always" happens, except in some rare scenarios where a parabolic blowoff move occurs. Anyway trading parabolic blowoffs is a dangerous sport and rare occurrence, which does not merit out attention. So in a normal market environment, 34 ema acts a magnet pulling prices towards it after a trend gets overbought. Trading rejections is basically participating in the trend after a correction is over. The rules of rejection are very simple and unambigous
For a Bullish rejection, the stock/index is trading above the 34 ema, comes down either close to the 34 ema or touches the 34 ema or undershoots the 34 ema and reverses. For the rejection candle (trade entry candle) , the following rules must be satisfied:
1) Candle close should be above 34 ema
2) Candle close should be above the high of the prior candle.
3) Candle close should be above the 8 EMA
I added the rule #3 as a refinement (or filter) to avoid taking weak rejections. If 1) and 2) are satisifed and 3) is not satisfied, then it means the correction is still in progress.
For a Bearish rejection, the stock/index is trading below the 34 ema, comes up either close to the 34 ema or touches the 34 ema or overshoots the 34 ema and reverses. For the rejection candle (trade entry candle) , the following rules must be satisfied:
1) Candle close should be below 34 ema
2) Candle close should be below the low of the prior candle.
3) Candle close should be below the 8 EMA
Here are some visual examples of rejections on both 15-min and 30-min charts which have occurred over the last few weeks. SL level for rejection is shown with a pink line and the valid rejection candles are shown in pink circles. Invalid rejections are shown in black circles.
15-min - nf1_15.gif, nf2_15.gif, nf3_15.gif
#1 - Invalid rejection. Rule 2) not satisfied.
#2,#3,#4 - Valid rejection. All rules satisfied.
#5 - Invalid rejection. Rule 2) not satisfied.
#6, #7 - Valid rejections
#8- Invalid rejection. Rule 2) not satisfied.
#9 - Valid rejection
#10 - Invalid rejection. Rule 2) not satisfied.
#11 - Valid rejection
#12,14,15,17,18 - valid rejections
#13 - Invalid rejection. Rule 2) not satisfied.
#16 - Invalid rejection. Rule 3) not satisfied.
If one had traded the valid rejections, most rejections made money except #6 and #17.
#6 occurred at the final stage of the trend, just before the trend reversal. But one has to take all the signals bcoz we never know for sure when the trend reverses.
#17 was a case of failed rejection.
So out of 12 valid rejections, there were only 2 failures. That's an 83% odds of success !
30-min - nf1_30.gif, nf2_30.gif, nf3_30.gif
#1 - Invalid rejection. Rule 3) not satisfied.
#2,#3, #4, #5 - Valid rejection. All rules satisfied.
#6 - Invalid rejection. Rule 2) not satisfied.
#7, #8 - valid rejection.
#8 although a valid rejection is hard to trade as the SL required is very huge. I would put that in the category of untraedable.
#7 is a case of rejection failure and would have lost money.
So out of 5 valid rejections, there was one failure - That's 80% odds of success !
- Speculator  |
|
|
| Back to top |
|
 |
chetan83
Brown Belt

Joined: 19 Feb 2010
Posts: 2037
|
Post: #255  Posted: Thu Jan 20, 2011 1:10 am Post subject: Re: Trading rejections Posted: Thu Jan 20, 2011 1:10 am Post subject: Re: Trading rejections |
 |
|
| Speculator wrote: | Trading rejections
It's been more than an year since the "Swing trading the Speculator way" was posted. I still get basic questions in the shout-box such as "Is this a valid rejection ?". So i thought i will revisit this subject again.
Trading rejections is a way of trading with the trend. Rejections are based on the concept of mean reversion. Once a trend change occurs, the prices cross the 34 ema. Once this move gets overextended or overbought, a mean reversion to the neutral level occurs. 34 ema and 55 ema are generally the neutral levels on 15-min and 30-min timeframes. One can choose either 34 or 55 ema and both are equally valid. I personally use the 34 ema on both 15-min and 30-min timeframes for Nifty. Depending on the volatility of the stock and the timeframe, this neutral level can change. For instance on the 60-min timeframe, 13 ema happens to be the neutral level. I only trade 15-min and 30-min of Nifty generally. So let's focus on that.
Traders get anxious that they will miss a move, once a trend change occurs. But i would go to the extent of saying that a mean reversion to 34 ema "always" happens, except in some rare scenarios where a parabolic blowoff move occurs. Anyway trading parabolic blowoffs is a dangerous sport and rare occurrence, which does not merit out attention. So in a normal market environment, 34 ema acts a magnet pulling prices towards it after a trend gets overbought. Trading rejections is basically participating in the trend after a correction is over. The rules of rejection are very simple and unambigous
For a Bullish rejection, the stock/index is trading above the 34 ema, comes down either close to the 34 ema or touches the 34 ema or undershoots the 34 ema and reverses. For the rejection candle (trade entry candle) , the following rules must be satisfied:
1) Candle close should be above 34 ema
2) Candle close should be above the high of the prior candle.
3) Candle close should be above the 8 EMA
I added the rule #3 as a refinement (or filter) to avoid taking weak rejections. If 1) and 2) are satisifed and 3) is not satisfied, then it means the correction is still in progress.
For a Bearish rejection, the stock/index is trading below the 34 ema, comes up either close to the 34 ema or touches the 34 ema or overshoots the 34 ema and reverses. For the rejection candle (trade entry candle) , the following rules must be satisfied:
1) Candle close should be below 34 ema
2) Candle close should be below the low of the prior candle.
3) Candle close should be below the 8 EMA
Here are some visual examples of rejections on both 15-min and 30-min charts which have occurred over the last few weeks. SL level for rejection is shown with a pink line and the valid rejection candles are shown in pink circles. Invalid rejections are shown in black circles.
15-min - nf1_15.gif, nf2_15.gif, nf3_15.gif
#1 - Invalid rejection. Rule 2) not satisfied.
#2,#3,#4 - Valid rejection. All rules satisfied.
#5 - Invalid rejection. Rule 2) not satisfied.
#6, #7 - Valid rejections
#8- Invalid rejection. Rule 2) not satisfied.
#9 - Valid rejection
#10 - Invalid rejection. Rule 2) not satisfied.
#11 - Valid rejection
#12,14,15,17,18 - valid rejections
#13 - Invalid rejection. Rule 2) not satisfied.
#16 - Invalid rejection. Rule 3) not satisfied.
If one had traded the valid rejections, most rejections made money except #6 and #17.
#6 occurred at the final stage of the trend, just before the trend reversal. But one has to take all the signals bcoz we never know for sure when the trend reverses.
#17 was a case of failed rejection.
So out of 12 valid rejections, there were only 2 failures. That's an 83% odds of success !
30-min - nf1_30.gif, nf2_30.gif, nf3_30.gif
#1 - Invalid rejection. Rule 3) not satisfied.
#2,#3, #4, #5 - Valid rejection. All rules satisfied.
#6 - Invalid rejection. Rule 2) not satisfied.
#7, #8 - valid rejection.
#8 although a valid rejection is hard to trade as the SL required is very huge. I would put that in the category of untraedable.
#7 is a case of rejection failure and would have lost money.
So out of 5 valid rejections, there was one failure - That's 80% odds of success !
- Speculator  |
Hi Spec,
I checked ur points on rejection even on 5 min TF, even they suffice in those charts. Points here to be asked is, do we need to switch to 13 EMA for shorter time frames?
|
|
| Back to top |
|
 |
|
|
You cannot post new topics in this forum
You cannot reply to topics in this forum
You cannot edit your posts in this forum
You cannot delete your posts in this forum
You cannot vote in polls in this forum
You can attach files in this forum
You can download files in this forum
|
Powered by phpBB © 2001, 2005 phpBB Group
|
|
|

