| View previous topic :: View next topic |
| Author |
Swing Trading : The Speculator way |
Ravi_S
Yellow Belt

Joined: 15 Jun 2009
Posts: 569
|
|
| Back to top |
|
 |
|
|
 |
Ravi_S
Yellow Belt

Joined: 15 Jun 2009
Posts: 569
|
Post: #272  Posted: Fri Feb 04, 2011 11:55 am Post subject: Posted: Fri Feb 04, 2011 11:55 am Post subject: |
 |
|
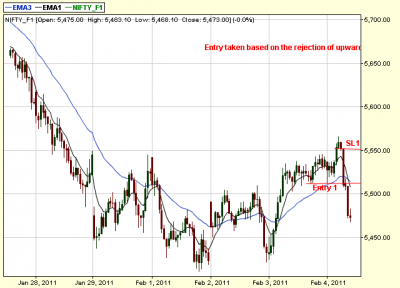
Is this entry correct or do we need to follow the rules
1. Close below 34 ema - True
2. Close below 8 ema - True
3. Candle closed below the previous candle low.
If this is the entry point the entry should have been at 5472.65 which is the low of the big red candle below 34 ema... Pls confirm
Regards
Ravi
| Description: |
|
| Filesize: |
19.3 KB |
| Viewed: |
479 Time(s) |
|
|
|
| Back to top |
|
 |
Jai2000
White Belt

Joined: 09 Aug 2010
Posts: 346
|
Post: #273  Posted: Sat Feb 05, 2011 8:15 pm Post subject: Trading With 5TF pivots Posted: Sat Feb 05, 2011 8:15 pm Post subject: Trading With 5TF pivots |
 |
|
Hello Dharma& Friends,
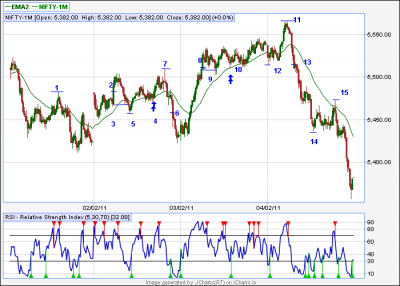
Here i'm trying to explain my trading with 5Tf Pivots.The most advantage is, it require minimum SL.I attach 4 charts include NF & i marked ENTRY & STOP LOSS.Profit booking is yr choice!I didnt add or modify any rules, just blindly follow what spec sir explained to us!
Spec/sekhar sir pls correct me, if any of my entry was wrong.Always thanking to Spec sir,Sekhar Sir & ichart team.
Regards,
Jai
| Description: |
1.5482.40 Dwn Pivot- (1/2/"11)
2.Pivot crosed our teade trigerd wth SL of 5467.20.
3.15 Points SL hit.
4.Re Entry based on rejection & 30 points profits.
5.5458 is the New Up Pivot.Because we made new high @5410.
6.Up pivot taken out & we sho |
|
| Filesize: |
27.48 KB |
| Viewed: |
537 Time(s) |
|
| Description: |
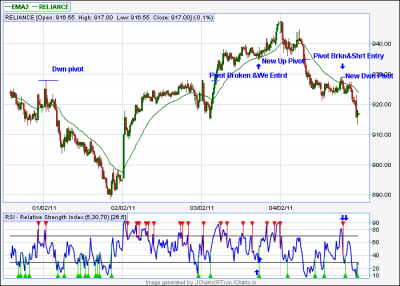
| 927.70 was our Dwn pivot.It crosed 3/2/"11 & made high 939.70.Then pullback to 34 ema & New high was 947.40. 934.65 was our new Upswing pivot . It broken 4/2/"11 & made low 921.35.Again pullback to 34 ema & made new low @913.40.N |
|
| Filesize: |
29.29 KB |
| Viewed: |
489 Time(s) |
|
| Description: |
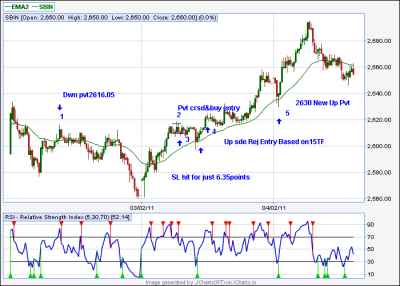
| 2616.05 was dwn pivot.It crose 3/2/"11. Our entry abv 2616.05 with SL of 2610.25. 6.35 points intra SL hit.Next upside entry it made same day in 15Tf . Our entry @2615 wth SL of 2597.55.It made new high @2658.50. Now 2630 is our Up pivot. |
|
| Filesize: |
23.53 KB |
| Viewed: |
440 Time(s) |
|
| Description: |
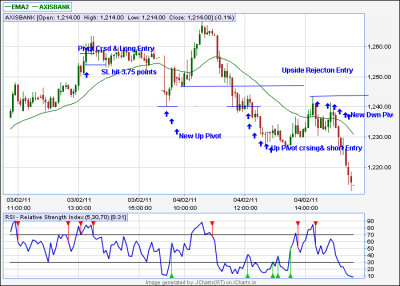
| 1257.65 was Dwn swing pivot.It crosd 3/2/"11 so our entry would be abv 1257.65 & Intra SL must be the Break out candle's Low.Our SL hit @1254.3.75 points SL hit.Next day we got bullish rejection-our entry 1251 wth SL of 1246.It created New high@1 |
|
| Filesize: |
25.77 KB |
| Viewed: |
456 Time(s) |
|
|
|
| Back to top |
|
 |
shekharinvest
Yellow Belt

Joined: 21 Dec 2007
Posts: 549
|
Post: #274  Posted: Sat Feb 05, 2011 8:18 pm Post subject: Posted: Sat Feb 05, 2011 8:18 pm Post subject: |
 |
|
Ravi
Answer to your first post is easy.
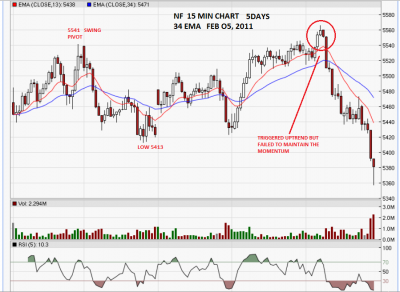
5541 was the Swing pivot, once price moved above 5541 Long is triggered and the trend turns positive. You could have placed the SL just below the entry candle or below the recent lows 5515-16. As we saw later on there was no follow thru you could have closed your position at min loss or let the SL hit. Long toh banta hai ! simple type I entry.
Second post indicating short entry is quite tricky here as I have encountered this kind of situation for the first time only.
(I am not sure whether we can call this as rejection since the price has breached the upswing pivot and now came down).
Let me explain.
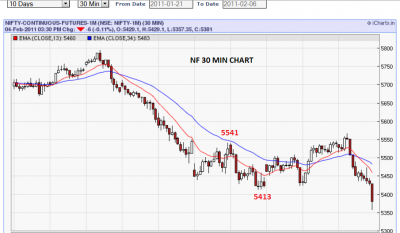
Once we have triggered Long by surpassing the upswing pivot 5541, technically we are in uptrend and the down swing pivot is now at 5413 below which down trend begins, short can be initiated only below 5413, or once price gets rejected from 34 EMA on the downside which is yet to happen.
Almost same is the position on 30 min TF. Which I follow these days.
Please note that I am not trading actively these days and all this analysis is with the benefit of hindsight.
I look forward to Speculator to kindly help. I hope, I have made myself clear and Speculator will - with his vast experience help resolve the predicament. Infact, how exactly did he trade the price movements ?
SHEKHAR
| Description: |
|
| Filesize: |
101.24 KB |
| Viewed: |
577 Time(s) |
|
| Description: |
|
| Filesize: |
77.5 KB |
| Viewed: |
471 Time(s) |
|
Last edited by shekharinvest on Sun Feb 06, 2011 12:40 pm; edited 1 time in total |
|
| Back to top |
|
 |
Jai2000
White Belt

Joined: 09 Aug 2010
Posts: 346
|
Post: #275  Posted: Sat Feb 05, 2011 8:57 pm Post subject: Trading With 5Tf pivots Posted: Sat Feb 05, 2011 8:57 pm Post subject: Trading With 5Tf pivots |
 |
|
Hi all,
Sorry something missed in previous msg.Dont know how it happend.... Anyway here i'm explain.Sorry for inconvenient.
Nifty
1. 5482.40 dwn pivot
2.pvt crosd & we r in buy with SL of 5467.25
3.Our SL hit for 15 points
4.Re entry BAsed on rejectin 5485 to 5410
5.5458 is the New Up pivot.
6.5458 taken out & we r in short.5458 - 5423.
7.After 5423 we didnt made new low, so our Dwn pivot remain@ 5410.
8.Long trigerd & 5410
9. SL hit for Just 1 point.
10.Upside rejection & entry would be 5423. 5423- 5464.80
11.5464.80 is new high
12.5515 is our Up pivot
13. 4/2/"11- 11.15 pivot taken out & we r in short.
14.5437 was the low . bullback to 5473 & made new low @5357.35.
15. Our new Dwn pivot is 5473.
Reliance
1.928.50( 30/1/"11- 11.30hrs)- sry i mentnd 927.70 earlier
2. Dwn pivot crosed 3/2/"11- 10.15 & made high 939.70.After the pullback to 34 ema it made New High @947.40.
3.934.65 was our Up pivot.
4.It broken 4/2/ '11- 11.05 & made low 921.35.
5. Again pullback to 34 ema & made new low @913.40.
6. Now New Dwn pivot is 929.
SBIN
1. 2616.05 (2/2/"11- 11.40) was the Dwn pivot.
2. 3/2 - 11 hrs ir crosd. We r long with Sl of 2610.25 .
3. Our Sl got hit for 6.35 points.
4.Next entry based on 15 Tf upside rejection @2615 wth sl of 2597.55. It made new high @2658.50
5. 2630 is our New Upswing Pivot.
AXIS
1.1257.65 was Dwn pivot- ( 1/2/"11- 9.20)
2 3/2 -13.20 we r long wth SL of 1254.10.
3. 3.75 points Sl hit
4. Next entry 4/2/"11 based on Upside rejection. 1250 to 1268.30
5.1240.30 was our new Up Pivot.
6. It taken out 4/2/"11-11.35 & we r in short.
7. 1240.30 to 1227. Again bullback to 34 EMA 7 made New low 1212.20.
8. Now our New Dwn pivot is1243.50.
Hope I dont confuse anybody......
Regards,
jai.
[/b]
|
|
| Back to top |
|
 |
Ravi_S
Yellow Belt

Joined: 15 Jun 2009
Posts: 569
|
Post: #276  Posted: Mon Feb 07, 2011 2:20 pm Post subject: Posted: Mon Feb 07, 2011 2:20 pm Post subject: |
 |
|
Shekar
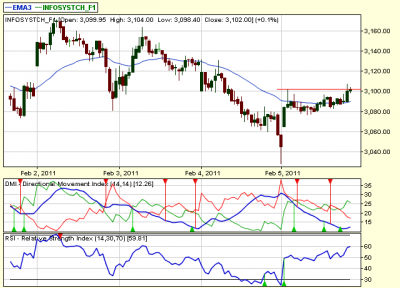
I've initiated an entry in Infy.... based on SPEC"s method...
1. Price closing above 34 ema.
2. Price closing above high of previous candle
3. Price closing above 8 ema.
What should be the SL for this?
Regards
Ravi
| Description: |
|
| Filesize: |
27.43 KB |
| Viewed: |
460 Time(s) |
|
|
|
| Back to top |
|
 |
shekharinvest
Yellow Belt

Joined: 21 Dec 2007
Posts: 549
|
Post: #277  Posted: Mon Feb 07, 2011 3:49 pm Post subject: Posted: Mon Feb 07, 2011 3:49 pm Post subject: |
 |
|
| Ravi_S wrote: | Shekar
I've initiated an entry in Infy.... based on SPEC"s method...
1. Price closing above 34 ema.
2. Price closing above high of previous candle
3. Price closing above 8 ema.
What should be the SL for this?
Regards
Ravi |
Ravi,
This is quick reply based on your chart, there is no reason to long here, probably the swing pivot is somewhere at 3160+ on Feb. 03, Long above that only.
SHEKHAR
|
|
| Back to top |
|
 |
Ravi_S
Yellow Belt

Joined: 15 Jun 2009
Posts: 569
|
Post: #278  Posted: Mon Feb 07, 2011 5:53 pm Post subject: Posted: Mon Feb 07, 2011 5:53 pm Post subject: |
 |
|
Shekar
But I read somewhere that long can be initiated after a candle closes above the preivous candle's high and above 8 and34 EMA? Am I missing something here?
Regards
Ravi
| shekharinvest wrote: | | Ravi_S wrote: | Shekar
I've initiated an entry in Infy.... based on SPEC"s method...
1. Price closing above 34 ema.
2. Price closing above high of previous candle
3. Price closing above 8 ema.
What should be the SL for this?
Regards
Ravi |
Ravi,
This is quick reply based on your chart, there is no reason to long here, probably the swing pivot is somewhere at 3160+ on Feb. 03, Long above that only.
SHEKHAR |
|
|
| Back to top |
|
 |
Ravi_S
Yellow Belt

Joined: 15 Jun 2009
Posts: 569
|
Post: #279  Posted: Mon Feb 07, 2011 5:57 pm Post subject: Posted: Mon Feb 07, 2011 5:57 pm Post subject: |
 |
|
Shekar
got it, I was trying to trade the bullish rejection, but alas the price has to be above 34 EMA for that  .. Since the price has come from below 34 ema I should not have traded that... .. Since the price has come from below 34 ema I should not have traded that...
So effectively summing up
Entries are defined as
1. Taking out the swing pivot
2. Bullish/Bearish Rejectsions
Am I right?
Regards
Ravi
| Ravi_S wrote: | Shekar
But I read somewhere that long can be initiated after a candle closes above the preivous candle's high and above 8 and34 EMA? Am I missing something here?
Regards
Ravi
| shekharinvest wrote: | | Ravi_S wrote: | Shekar
I've initiated an entry in Infy.... based on SPEC"s method...
1. Price closing above 34 ema.
2. Price closing above high of previous candle
3. Price closing above 8 ema.
What should be the SL for this?
Regards
Ravi |
Ravi,
This is quick reply based on your chart, there is no reason to long here, probably the swing pivot is somewhere at 3160+ on Feb. 03, Long above that only.
SHEKHAR |
|
|
|
| Back to top |
|
 |
Ravi_S
Yellow Belt

Joined: 15 Jun 2009
Posts: 569
|
Post: #280  Posted: Mon Feb 07, 2011 6:01 pm Post subject: Posted: Mon Feb 07, 2011 6:01 pm Post subject: |
 |
|
Shekar
But what is this given in Spec's document? 
"Now wait for the price to test the 34 ema and reverse back. You need to see at least one green candle above the 34 ema. That's around 4986. Now put a stop below the prior swing low 4937 and pray - mean it seriously. At this point we have no confirmation that a trend change has occurred. We are just speculating by taking a position. After some sideways move the price takes off. Until price moves above the prior swing pivot the trend change is not confirmed. In this case the prior swing pivot is at 5048. There are various ways to establish swing pivots. Some use pure price to do that. Some use momentum indicators. Some use moving avg. Momentum benchmarking of pivots is complex and I won't go there. "
I got confused between this and the rejection criteria. Can you please explain?
Regards
Ravi
|
|
| Back to top |
|
 |
shekharinvest
Yellow Belt

Joined: 21 Dec 2007
Posts: 549
|
Post: #281  Posted: Tue Feb 08, 2011 11:42 am Post subject: Posted: Tue Feb 08, 2011 11:42 am Post subject: |
 |
|
| Ravi_S wrote: | Shekar
But what is this given in Spec's document? 
"Now wait for the price to test the 34 ema and reverse back. You need to see at least one green candle above the 34 ema. That's around 4986. Now put a stop below the prior swing low 4937 and pray - mean it seriously. At this point we have no confirmation that a trend change has occurred. We are just speculating by taking a position. After some sideways move the price takes off. Until price moves above the prior swing pivot the trend change is not confirmed. In this case the prior swing pivot is at 5048. There are various ways to establish swing pivots. Some use pure price to do that. Some use momentum indicators. Some use moving avg. Momentum benchmarking of pivots is complex and I won't go there. "
I got confused between this and the rejection criteria. Can you please explain?
Regards
Ravi |
Ravi, I had just highlighted some of the key words which are self explonatory, you will get your answer. When the trend is not clear this is the way one can get entries. and then just PRAY 
Ref. your first post, you have got it right.
SHEKHAR
|
|
| Back to top |
|
 |
jjm
White Belt

Joined: 17 Mar 2010
Posts: 411
|
Post: #282  Posted: Tue Feb 15, 2011 5:21 pm Post subject: Failed trade in Tisco Posted: Tue Feb 15, 2011 5:21 pm Post subject: Failed trade in Tisco |
 |
|
Dear Specji/Shekhar,
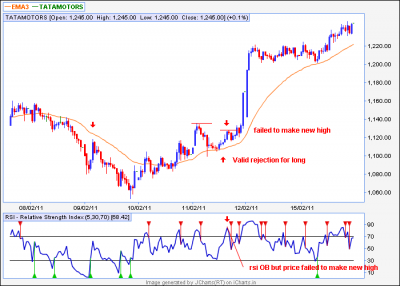
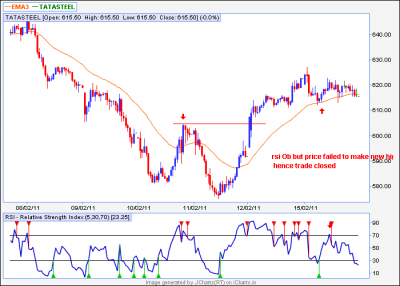
Today I closed my Tisco intra long due to failure in price making HH after getting valid rejection in 15 tf
On 11/02 same situation happened in Tamo..pls refer the charts attached along with..
As per rule if rsi gets OB and price fails to make HH we should not consider the rejection as a valid ..hence we would have closed the trade..have a look at charts latter on price made HH
So my doubt is where I should have reentered in Tamo
Now considering these both cases can you pls explain/comment when can I take a long entry in Tisco..because I am at same situation like TAMO
Regards,
JJM
| Description: |
|
| Filesize: |
21.1 KB |
| Viewed: |
566 Time(s) |
|
| Description: |
|
| Filesize: |
20.95 KB |
| Viewed: |
514 Time(s) |
|
|
|
| Back to top |
|
 |
Speculator
Expert

Joined: 15 Apr 2008
Posts: 149
|
Post: #283  Posted: Wed Feb 16, 2011 7:25 am Post subject: Posted: Wed Feb 16, 2011 7:25 am Post subject: |
 |
|
jjm,
When the RSI(5) gets OB and the price fails to make a new high, it's a warning that we may be in a range bound action as opposed to a trending action. Once the RSI(5) falls below 70 then it means that the rejection is danger. You can do one of the two things in such cases
1) Get out of the position fully
or
2) Trail your stop. One of the easiest ways to trail your stop is to use the PARSAR (parabolic SAR) as a trailing stop.
If you are out of your position and the market takes off again, it can get tricky. Again you can do one of the two things:
1) Take the next rejection
or
2) If you don't get any rejection, you can reenter as soon we make new recovery highs, with a trailing stop with the PARSAR.
Remember there will always be some odd cases to deal with in the market, no matter what system we use. One has to use some judgment in those cases or just let the trade pass and wait for the next trade.
- Speculator
|
|
| Back to top |
|
 |
jjm
White Belt

Joined: 17 Mar 2010
Posts: 411
|
Post: #284  Posted: Wed Feb 16, 2011 5:03 pm Post subject: Posted: Wed Feb 16, 2011 5:03 pm Post subject: |
 |
|
Dear Specji
Thanks for the reply.
Need to learn interpretation for PARSAR as well as ATR..
As expected Tisco did bounced back
Thanks once again for your valued support
Regards,
JJM
|
|
| Back to top |
|
 |
diwakar
White Belt

Joined: 10 Feb 2010
Posts: 54
|
Post: #285  Posted: Fri Feb 18, 2011 8:02 am Post subject: Copper Posted: Fri Feb 18, 2011 8:02 am Post subject: Copper |
 |
|
Hi Spec
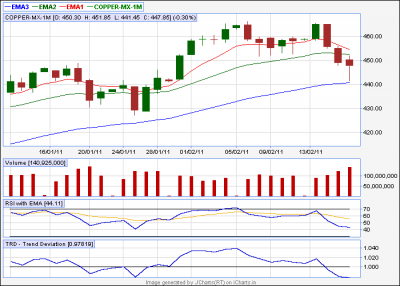
I am learning to swing trade based on EOD charts.
Please post your views on copper.
Thanks in advance.
Rgds,
Diwakar
| Description: |
|
| Filesize: |
11.74 KB |
| Viewed: |
413 Time(s) |
|
|
|
| Back to top |
|
 |
|

