| View previous topic :: View next topic |
| Author |
Swing Trading : The Speculator way |
sunrays
White Belt

Joined: 19 Dec 2009
Posts: 71
|
Post: #46  Posted: Thu Feb 11, 2010 12:01 am Post subject: Posted: Thu Feb 11, 2010 12:01 am Post subject: |
 |
|
| gud work speck n shekhar
|
|
| Back to top |
|
 |
|
|
|
shekharinvest
Yellow Belt

Joined: 21 Dec 2007
Posts: 549
|
| Post: #47 Posted: Thu Feb 11, 2010 4:40 pm Post subject: |
|
|
Hi,
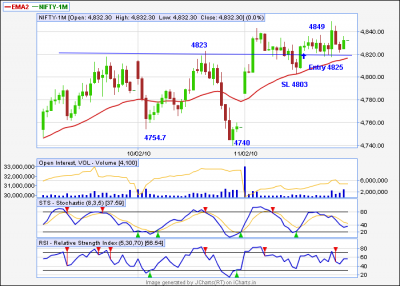
Made and entry on NF at 4825 with 4803 as SL, after a bullish rejection from 34EMA..
Did not go long above swing high for the simple reason and I quote Speculator here:
“After a 100 point move in 45 min I don't like to enter.
Yes, I am very patient guy. I know that market will always trade the remainder of the year and the price always comes to 34 ema at some point.”
In the end closed the trade at breakeven as we do not wish to carry trades into weekends which are not deep into profits.
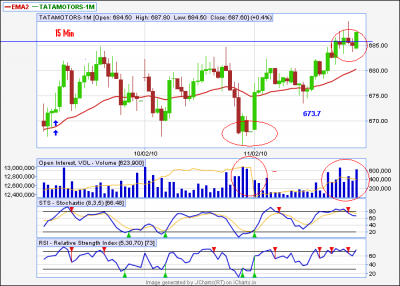
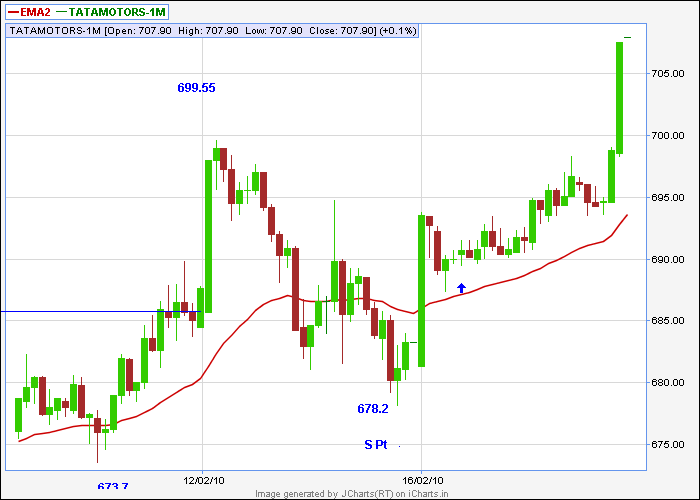
Today after many attempt at 684 finally Tatamotors could take out the swing pivot on closing basis. It was a genuine swing entry, but being quite late in the day and 3 holidays ahead not taken. Also see the increased volumes at the breakout today and at the supports previously. Very much suggestive of a good move coming up. If Monday start positive and we get it some where closer to 684-90 range one can enter or wait for a pullback to 34 EMA.
Did not enter on rejection from 34 was as it was moving in a range for quite sometime, and always stopped at close to 684
SHEKHAR
| Description: |
|
| Filesize: |
28.3 KB |
| Viewed: |
953 Time(s) |
|
| Description: |
|
| Filesize: |
38.66 KB |
| Viewed: |
820 Time(s) |
|
|
|
| Back to top |
|
|
npk1661
White Belt
Joined: 24 Oct 2009
Posts: 3
|
| Post: #48 Posted: Thu Feb 11, 2010 7:36 pm Post subject: |
|
|
dear shekhar
I have gone through the thread of yours. it is just amassing .However since i am new to this charts kindly if u can tell me how to get these charts of 15 minute with 34 ema and 5rsi ?do i need to be a paid member of I charts?hope I get reply as this is basics for u but its beginning for me . thanks in advance
|
|
| Back to top |
|
|
girishhu1
White Belt
Joined: 17 Aug 2009
Posts: 316
|
| Post: #49 Posted: Fri Feb 12, 2010 9:45 am Post subject: |
|
|
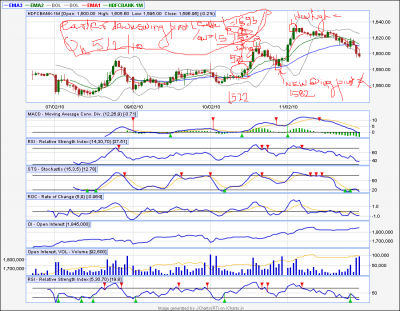
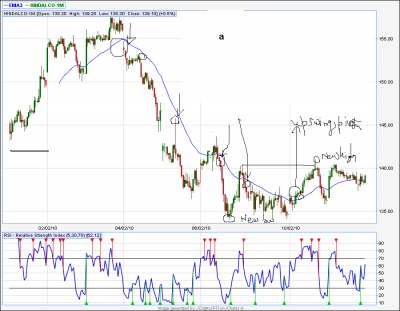
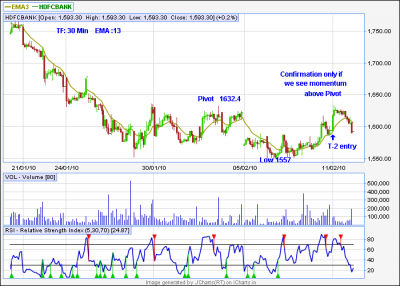
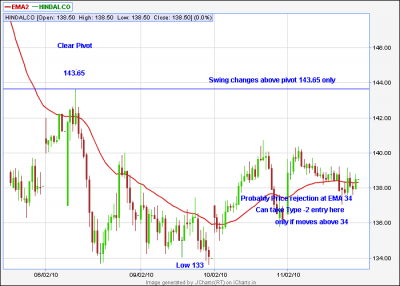
i am enclosing a chart of hdfc bk and hindalco. i would request spec ji and shekharinvestorji to check and comment regarding trend reversal, if any.
| Description: |
|
| Filesize: |
83.63 KB |
| Viewed: |
946 Time(s) |
|
| Description: |
|
| Filesize: |
58.24 KB |
| Viewed: |
862 Time(s) |
|
|
|
| Back to top |
|
|
Ravi_S
Yellow Belt
Joined: 15 Jun 2009
Posts: 569
|
| Post: #50 Posted: Fri Feb 12, 2010 11:50 am Post subject: |
|
|
Hi npk1661
Yes you need to be a paid member if you need to look at realtime charts. The non paid members would have access to Daily, Weekly and Monthly charts only. If you want to track Futures (Nifty, BankNifty etc.,) you need to be a premium member. Hope this answers your question.
Regards
Ravi
| npk1661 wrote: | dear shekhar
I have gone through the thread of yours. it is just amassing .However since i am new to this charts kindly if u can tell me how to get these charts of 15 minute with 34 ema and 5rsi ?do i need to be a paid member of I charts?hope I get reply as this is basics for u but its beginning for me . thanks in advance |
|
|
| Back to top |
|
|
Speculator
Expert

Joined: 15 Apr 2008
Posts: 149
|
| Post: #51 Posted: Fri Feb 12, 2010 12:23 pm Post subject: |
|
|
Today the market failed to continue the downtrend as was called the by downswing pivot we established on Wednesday. Instead we gapped up, made new highs and established a new upswing pivot. Typical range behaviour. Finally we got a bullish rejection from the 34 ema, which gave us a entry aroudn 4826. But again the market did not decisively breakout in terms of price or with volume conviction. They have now parked the price near the gap resistance at 4824. So either we gap-up again on Monday or gap-down back into range. The odds are still 50:50.
But technically now we are in a upswing, although a very weak uptrend at this stage. I decided not to take the risk of carrying long home, given that my positions were barely in profits nor was there a decisive breakout. Not to mention the 3 day weekend. My risk management is if i am at least about 40-50 points in profits or if the technical odds are in my favor, i carry positions overnight. That way even if there is a 100 point gap, my losses would be max 60 points.
Good luck !
- Speculator
| Description: |
|
| Filesize: |
36.41 KB |
| Viewed: |
1012 Time(s) |
|
|
|
| Back to top |
|
|
npk1661
White Belt
Joined: 24 Oct 2009
Posts: 3
|
| Post: #52 Posted: Fri Feb 12, 2010 2:13 pm Post subject: |
|
|
Hi Ravi
Thanks for your guidance and help  javascript:emoticon('') javascript:emoticon('')
|
|
| Back to top |
|
|
girishhu1
White Belt
Joined: 17 Aug 2009
Posts: 316
|
| Post: #53 Posted: Fri Feb 12, 2010 8:35 pm Post subject: |
|
|
spec sir ji and shekhar sir ji,
your daily analysis is quite helpful in learning swing technique. i would request u to kindly add previous upswing and downswing pivots, swing low/high, recovery high, new swing pivot,sl points on the charts enclosed, invariably, so that beginners concepts can be more clear. anyway u are doing a great job, god bless you both.
|
|
| Back to top |
|
|
shekharinvest
Yellow Belt
Joined: 21 Dec 2007
Posts: 549
|
| Post: #54 Posted: Sat Feb 13, 2010 12:28 pm Post subject: |
|
|
| girishhu1 wrote: | | i am enclosing a chart of hdfc bk and hindalco. i would request spec ji and shekharinvestorji to check and comment regarding trend reversal, if any. |
girishuu1,
HDFC Bank has given an entry. Upswing begin only above swing pivot.
Hindalco is presently in the sideways, upswing will begin only above 143.65.
Rest all is marked on the charts itself. Hope was of some help to you.
SHEKHAR
| Description: |
|
| Filesize: |
26.02 KB |
| Viewed: |
960 Time(s) |
|
| Description: |
|
| Filesize: |
15.25 KB |
| Viewed: |
878 Time(s) |
|
|
|
| Back to top |
|
|
girishhu1
White Belt
Joined: 17 Aug 2009
Posts: 316
|
| Post: #55 Posted: Sat Feb 13, 2010 5:06 pm Post subject: |
|
|
shekharji,
Thanks for your prompt reply. can u explain why timeframe of 30, instead of recommended 15 min and ema of 13, instead of spec recommended 34,in case of hdfc bank, is used? are there any other conditions for use of ema and timeframe? further, is it allright to use rsi5 with these changes?. please guide.further can u pl check whether nagarjun construction and yes bank are giving clear entry for swing reversal?
|
|
| Back to top |
|
|
girishjain20
White Belt
Joined: 14 Dec 2009
Posts: 2
|
| Post: #56 Posted: Sun Feb 14, 2010 12:17 am Post subject: |
|
|
| hi spec and sekhar, i want to know is the swing low now shifted to 4804 as we got support from there please confirm
|
|
| Back to top |
|
|
Speculator
Expert
Joined: 15 Apr 2008
Posts: 149
|
| Post: #57 Posted: Mon Feb 15, 2010 4:11 pm Post subject: |
|
|
I don't recall a time in the last 6-8 months where the market established so many pivots in such short span of a time. 8 pivots in 5 trading days. Lot of compression building here for a big move ! We are back into the range. No profitable positions. So not carrying anything overnight.
| Description: |
|
| Filesize: |
31.79 KB |
| Viewed: |
996 Time(s) |
|
|
|
| Back to top |
|
|
shekharinvest
Yellow Belt
Joined: 21 Dec 2007
Posts: 549
|
| Post: #58 Posted: Tue Feb 16, 2010 4:08 pm Post subject: |
|
|
| Speculator wrote: | | I don't recall a time in the last 6-8 months where the market established so many pivots in such short span of a time. 8 pivots in 5 trading days. Lot of compression building here for a big move ! We are back into the range. No profitable positions. So not carrying anything overnight. |
Bingo !
The spring has been released today! Watch out for the big move ahead.
We had type -2 entry today and saw momentum at the crucial points.
Entries are marked with UP arrows
SHEKHAR
| Description: |
|
| Filesize: |
11.36 KB |
| Viewed: |
7167 Time(s) |
|
| Description: |
|
| Filesize: |
18.13 KB |
| Viewed: |
863 Time(s) |
|
Last edited by shekharinvest on Tue Feb 16, 2010 4:36 pm; edited 1 time in total |
|
| Back to top |
|
|
Speculator
Expert
Joined: 15 Apr 2008
Posts: 149
|
| Post: #59 Posted: Tue Feb 16, 2010 4:16 pm Post subject: Classic Type II reversal |
|
|
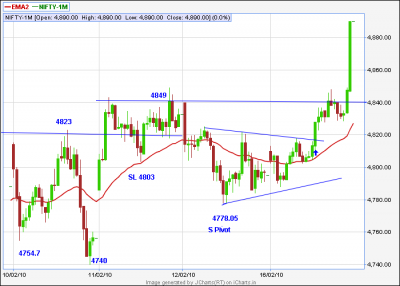
Today the market was whipping around in a tight triangle, putting everyone to sleep. Finally we had the Type II reversal, where the price moves above the 34 ema, goes down tests the 34 ema and gets a bullish rejection. Type II reversals are countertrend in nature and you have to pray that the swing pivot gets taken out (4849 in this case) and swing reversal happens.
The circled candle was the reversal candle which would have given the best entry price. I chose to take the entry at the next candle which broke out of the triangle around NF 4825, to avoid whipsaws. The compression that i mentioned yesterday is now released. Current swing pivot is 4777, which is a good SL for this swing move. Ride the move until the next reversal...
- Speculator
| Description: |
|
| Filesize: |
40.94 KB |
| Viewed: |
1085 Time(s) |
|
|
|
| Back to top |
|
|
shekharinvest
Yellow Belt
Joined: 21 Dec 2007
Posts: 549
|
| Post: #60 Posted: Tue Feb 16, 2010 4:33 pm Post subject: |
|
|
| girishhu1 wrote: | shekharji,
can u explain why timeframe of 30, instead of recommended 15 min and ema of 13, instead of spec recommended 34,in case of hdfc bank, is used? are there any other conditions for use of ema and timeframe? |
girishhu1
There is no hard and fast rule to take 15 min TF and 34 EMA. You need to experiment with TF's and EMA's and get the right fit for the stock you want to trade.
SHEKHAR
|
|
| Back to top |
|
|
|


