| View previous topic :: View next topic |
| Author |
Swing Trading : The Speculator way |
Speculator
Expert

Joined: 15 Apr 2008
Posts: 149
|
Post: #76  Posted: Thu Feb 25, 2010 8:05 pm Post subject: Posted: Thu Feb 25, 2010 8:05 pm Post subject: |
 |
|
Swing pivot remains at 4777. Nothing new to add here. Feb has been a horrible month for traders, with very low levels of volatility. The last 8 days we have been stuck in triangle. The resolution will be fast and violent and my bet is it will be down.
Why down ?
Because the A/D line made fresh lows today.
http://www.icharts.in/breadth-charts.html
|
|
| Back to top |
|
 |
|
|
 |
smsmss
White Belt

Joined: 13 Oct 2009
Posts: 123
|
Post: #77  Posted: Thu Mar 04, 2010 1:07 am Post subject: Posted: Thu Mar 04, 2010 1:07 am Post subject: |
 |
|
hi spec, shekhar....
new swing pivot is 4919.45 right if i have not mistaken...
market is making higher highs everyday, and the uptrend has started...looking forward to your inputs...
|
|
| Back to top |
|
 |
Speculator
Expert

Joined: 15 Apr 2008
Posts: 149
|
Post: #78  Posted: Thu Mar 04, 2010 4:50 pm Post subject: Posted: Thu Mar 04, 2010 4:50 pm Post subject: |
 |
|
sms,
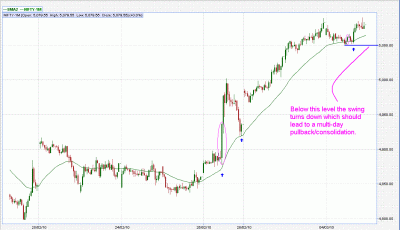
Sorry, i have been very busy the last few days. I will try to update the forum at the end of the day, given that i will not be active in the SB during the trading hours.
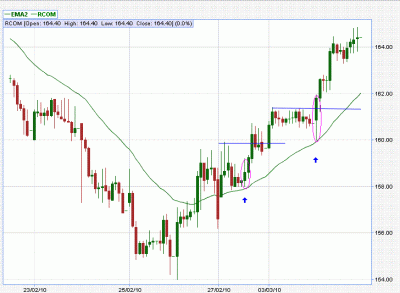
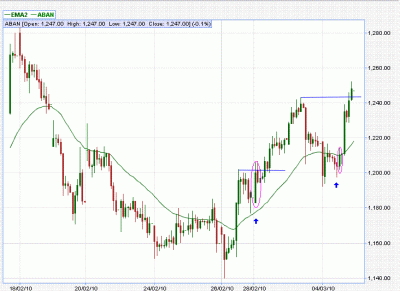
I will post the Nifty chart (15-min 34 ema) with brief comments everyday. Also i will post charts of a couple of stocks that i am following or actively trading (30-min 34 ema for stocks).
- Speculator 
| Description: |
|
| Filesize: |
29.18 KB |
| Viewed: |
971 Time(s) |
|
| Description: |
|
| Filesize: |
20.42 KB |
| Viewed: |
767 Time(s) |
|
| Description: |
|
| Filesize: |
21.29 KB |
| Viewed: |
717 Time(s) |
|
|
|
| Back to top |
|
 |
smsmss
White Belt

Joined: 13 Oct 2009
Posts: 123
|
Post: #79  Posted: Thu Mar 04, 2010 8:26 pm Post subject: Posted: Thu Mar 04, 2010 8:26 pm Post subject: |
 |
|
thanx a ton Spec for sparing some time for us and updating the thread....
Spec the question is how to decide on profit taking for these stocks...for NF it was 30% on first 100 points and so on and so forth...but how to go for these?...
|
|
| Back to top |
|
 |
greatshiva
White Belt

Joined: 15 Dec 2009
Posts: 16
|
Post: #80  Posted: Fri Mar 05, 2010 3:54 am Post subject: Posted: Fri Mar 05, 2010 3:54 am Post subject: |
 |
|
| As usual u are excellent Spec... Rocking stuff dude
|
|
| Back to top |
|
 |
SID2060
White Belt

Joined: 04 Nov 2009
Posts: 319
|
Post: #81  Posted: Fri Mar 05, 2010 3:10 pm Post subject: """THE MAGIC OF BETAS""" Posted: Fri Mar 05, 2010 3:10 pm Post subject: """THE MAGIC OF BETAS""" |
 |
|
DEAR SIR,
PLEASE ADD A COLUMN IN THE SCREENER (EOD), A COLUMN SHOWING ""THE BETA VALUE"" OF EACH SCRIP.. THOSE SCRIPS WHOSE ONE YEAR DATA IS AVAILABLE, BETA VALUE WILL BE CALCULATED FOR THEM ONLY TO MAINTAIN THE STANDARDS AND ACCURACY..
ALSO BEFORE CALCULATING THE BETA VALUE ALL THE ADJUSTMENTS TO THE PRICE LIKE SPLIT, BONUS, BUYBACK DIVIDEND ETC ETC SHOULD BE MADE..
A ""BETA VALUE"" DESCRIBES THE RELATIONSHIP BETWEEN THE SCRIP AND THE BENCHMARK INDEX LIKE NIFTY/SENSEX..
INVESTORS SHOULD INVEST IN SCRIPS WITH BETA VALUE RANGING FROM 0.75 TO 1.35
WHILE THE DAY TRADERS SHOULD BUY/SELL SCRIPS WITH HIGHER BETA VALUE ABOVE 1.0 (ONE) IN ORDER TO HAVE MORE VOLATILITY/MOVEMENT IN BOTH UP AND DOWN SIDE..
THANKS A LOT,
SIDDHARTH

|
|
| Back to top |
|
 |
Speculator
Expert

Joined: 15 Apr 2008
Posts: 149
|
Post: #82  Posted: Sun Mar 07, 2010 9:01 pm Post subject: Posted: Sun Mar 07, 2010 9:01 pm Post subject: |
 |
|
sms,
As for profit taking on stocks, you could take off 30% at 1:3 risk/reward, another 30% at 1:6 risk/reward and final 30% on swing reversal or a big move.
Nothing much happened in the markets on friday except that the pivot held. Given the strong performance in the U.S markets on friday, a gap-up in Nifty on Monday is very likely. Will update the charts after Monday market close.
|
|
| Back to top |
|
 |
Speculator
Expert

Joined: 15 Apr 2008
Posts: 149
|
Post: #83  Posted: Mon Mar 08, 2010 3:55 pm Post subject: Posted: Mon Mar 08, 2010 3:55 pm Post subject: |
 |
|
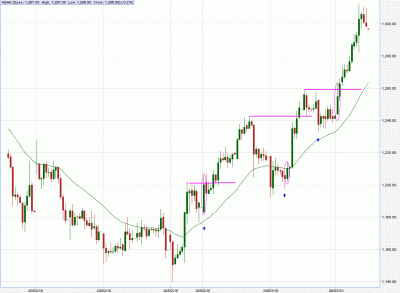
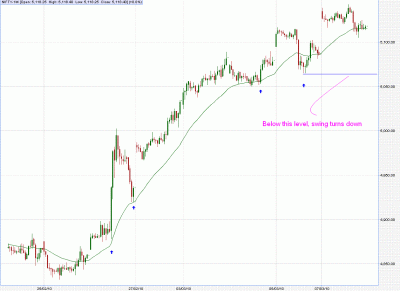
Nifty remains on a swing buy.
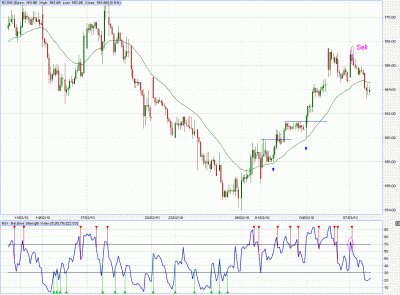
RCOM was a sell today. RSI got OB and turned down, but price failed to make new recovery highs.
ABAN continues to trend well. It was definitely a day to take partial profits on this one.
| Description: |
|
| Filesize: |
33.82 KB |
| Viewed: |
807 Time(s) |
|
| Description: |
|
| Filesize: |
50.45 KB |
| Viewed: |
816 Time(s) |
|
| Description: |
|
| Filesize: |
29.41 KB |
| Viewed: |
862 Time(s) |
|
|
|
| Back to top |
|
 |
smsmss
White Belt

Joined: 13 Oct 2009
Posts: 123
|
|
| Back to top |
|
 |
Speculator
Expert

Joined: 15 Apr 2008
Posts: 149
|
Post: #85  Posted: Wed Mar 10, 2010 9:03 am Post subject: Posted: Wed Mar 10, 2010 9:03 am Post subject: |
 |
|
sms,
Glad to see you trading using the system and making money. Congrats !
|
|
| Back to top |
|
 |
shekharinvest
Yellow Belt

Joined: 21 Dec 2007
Posts: 549
|
Post: #86  Posted: Thu Mar 11, 2010 3:53 pm Post subject: Posted: Thu Mar 11, 2010 3:53 pm Post subject: |
 |
|
Hi,
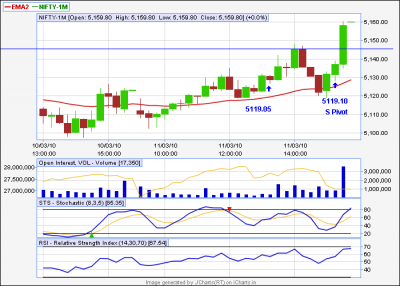
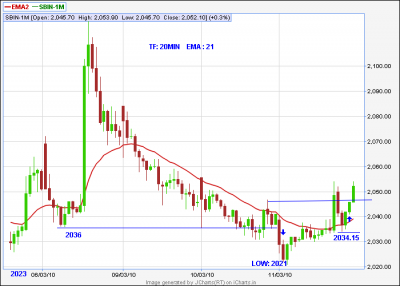
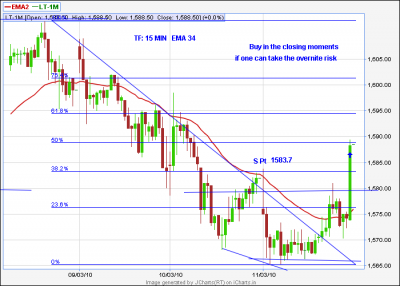
Posted below are couple of charts, with possible entries marked.
SHEKHAR
| Description: |
|
| Filesize: |
23.34 KB |
| Viewed: |
802 Time(s) |
|
| Description: |
|
| Filesize: |
14.5 KB |
| Viewed: |
703 Time(s) |
|
| Description: |
|
| Filesize: |
22.17 KB |
| Viewed: |
736 Time(s) |
|
|
|
| Back to top |
|
 |
SID2060
White Belt

Joined: 04 Nov 2009
Posts: 319
|
Post: #87  Posted: Sun Mar 14, 2010 3:11 pm Post subject: THE "MAGIC" OF BETA.. WORLD INDEXES "BETA&quo Posted: Sun Mar 14, 2010 3:11 pm Post subject: THE "MAGIC" OF BETA.. WORLD INDEXES "BETA&quo |
 |
|
| Speculator wrote: | sms,
Glad to see you trading using the system and making money. Congrats ! |
| Description: |
| PLZ DOWNLOAD THE ATTACHED PDF FILE. MUST DOWNLOAD. VERY USEFUL SHOWING THE CORRELATION BETWEEN ALL THE INTERNATIONAL STOCK MARKET...... |
|

Download |
| Filename: |
WORLD INDEX BETA.pdf |
| Filesize: |
4.94 KB |
| Downloaded: |
826 Time(s) |
|
|
| Back to top |
|
 |
Speculator
Expert

Joined: 15 Apr 2008
Posts: 149
|
Post: #88  Posted: Mon Mar 15, 2010 8:24 am Post subject: Posted: Mon Mar 15, 2010 8:24 am Post subject: |
 |
|
SID2060,
I would request you to please stop posting irrelevant information not pertaining to swing pivots system in this thread. If you wish to post some useful information, please create a new thread. Let's not pollute this thread, the intention of which is to educate folks in swing trading.
Thanks
Speculator
|
|
| Back to top |
|
 |
Speculator
Expert

Joined: 15 Apr 2008
Posts: 149
|
Post: #89  Posted: Mon Mar 15, 2010 5:21 pm Post subject: Posted: Mon Mar 15, 2010 5:21 pm Post subject: |
 |
|
Swing pivot on Nifty 60-min at 5092 held again today. So Nifty remains on a upswing. All action above 5092 should be considered as high level consolidation.
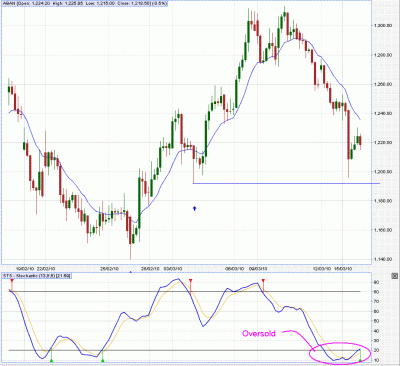
Interestingly many stocks got oversold today, without breaking their swing pivots, like ABAN, Tatasteel, TataMotors etc. So tommorow if these stocks hold above their swing pivots and breakout, then it is bullish and i will be a buyer. On the other hand if they break below their hourly swing pivots, i will start shorting these stocks on bounces. Tommorow, hopefully will be an interesting day.
Here's a chart of ABAN which shows that situation. We are oversold as indicated by the stochastics but we could not break the swing pivot. So the strategy for tommorow is simple. If we break below the swing pivot, short any bounces. If we breakout with a hourly close above 13 ema, go long. Tatasteel, Tatamotors are also in a similar situation.
- Speculator
| Description: |
|
| Filesize: |
41.04 KB |
| Viewed: |
822 Time(s) |
|
|
|
| Back to top |
|
 |
shekharinvest
Yellow Belt

Joined: 21 Dec 2007
Posts: 549
|
Post: #90  Posted: Mon Mar 15, 2010 5:59 pm Post subject: Posted: Mon Mar 15, 2010 5:59 pm Post subject: |
 |
|
Speculator,
Nice insight into the market action.
This choppy market is providing ample learning opportunities , if not any trading opportunity.
SHEKHAR
|
|
| Back to top |
|
 |
|

