| View previous topic :: View next topic |
| Author |
Swing Trading using DMI n EMA |
singh.ravee
Yellow Belt

Joined: 12 Aug 2010
Posts: 678
|
Post: #16  Posted: Sat Sep 17, 2011 2:24 pm Post subject: Posted: Sat Sep 17, 2011 2:24 pm Post subject: |
 |
|
| Arjun20 wrote: |
A bit more @2 and 4 o'clock pls. |
2 o'clock refers to slope of ema in uptrend and 4 o'clock in downtrend. normally represents robust trend.
look at the chart of bataindia below, the slope of ema resembles the hour hand of a clock in 2 o'clock position.
jugaad technology 
rgds
ravee
|
|
| Back to top |
|
 |
|
|
 |
singh.ravee
Yellow Belt

Joined: 12 Aug 2010
Posts: 678
|
Post: #17  Posted: Sat Sep 17, 2011 2:30 pm Post subject: Posted: Sat Sep 17, 2011 2:30 pm Post subject: |
 |
|
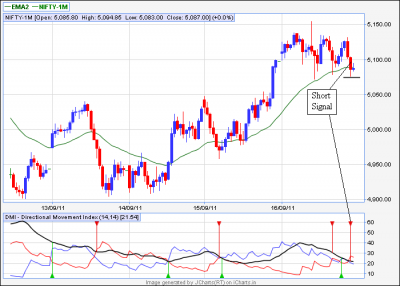
Will this short signal on nifty-1m 15min trigger ??
rgds
ravee
| Description: |
|
| Filesize: |
34.15 KB |
| Viewed: |
558 Time(s) |
|
|
|
| Back to top |
|
 |
singh.ravee
Yellow Belt

Joined: 12 Aug 2010
Posts: 678
|
Post: #18  Posted: Tue Sep 20, 2011 5:45 pm Post subject: Posted: Tue Sep 20, 2011 5:45 pm Post subject: |
 |
|
Hi,
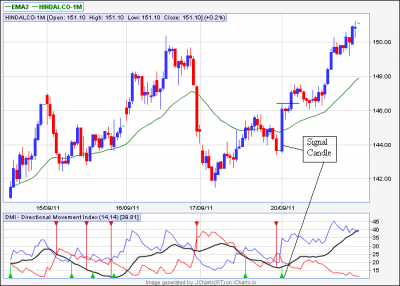
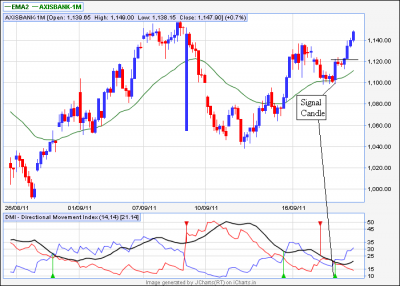
I took 2 trades today; axis in 60min and hindalco in 15min
Some fine tuning is required in 15min tf to reduce whipsaws. Still working on it
Happy Trading
Ravee
| Description: |
|
| Filesize: |
36.75 KB |
| Viewed: |
504 Time(s) |
|
| Description: |
|
| Filesize: |
35.87 KB |
| Viewed: |
470 Time(s) |
|
|
|
| Back to top |
|
 |
singh.ravee
Yellow Belt

Joined: 12 Aug 2010
Posts: 678
|
Post: #19  Posted: Wed Sep 21, 2011 9:36 am Post subject: Posted: Wed Sep 21, 2011 9:36 am Post subject: |
 |
|
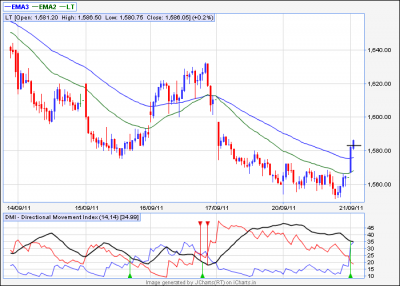
Buy triggered in L&T 15min.
regards
ravee
| Description: |
|
| Filesize: |
27.4 KB |
| Viewed: |
488 Time(s) |
|
|
|
| Back to top |
|
 |
singh.ravee
Yellow Belt

Joined: 12 Aug 2010
Posts: 678
|
Post: #20  Posted: Wed Sep 21, 2011 1:05 pm Post subject: Posted: Wed Sep 21, 2011 1:05 pm Post subject: |
 |
|
sl triggered.
rgds
ravee
|
|
| Back to top |
|
 |
Gemini
White Belt

Joined: 28 Apr 2009
Posts: 166
|
Post: #21  Posted: Wed Sep 21, 2011 1:52 pm Post subject: Posted: Wed Sep 21, 2011 1:52 pm Post subject: |
 |
|
Ravee,
Thanks a lot for this thrade. I always thought that 34 ema is a good indicator. Your suggestion of adding DMI has really sharpened this strategy. I think 15 min is little too short and creates whip-saw.
BTW, TCS has given sell signal sometime ago on 30 min TF.
|
|
| Back to top |
|
 |
singh.ravee
Yellow Belt

Joined: 12 Aug 2010
Posts: 678
|
Post: #22  Posted: Wed Sep 21, 2011 2:18 pm Post subject: Posted: Wed Sep 21, 2011 2:18 pm Post subject: |
 |
|
| Gemini wrote: | Ravee,
I think 15 min is little too short and creates whip-saw.
BTW, TCS has given sell signal sometime ago on 30 min TF. |
gemini,
yes for 60min its working good.
i too am trying to improvise on 15min tf. the thing is at place and i m testing it.
regard
ravee
|
|
| Back to top |
|
 |
singh.ravee
Yellow Belt

Joined: 12 Aug 2010
Posts: 678
|
Post: #23  Posted: Wed Sep 21, 2011 5:32 pm Post subject: Posted: Wed Sep 21, 2011 5:32 pm Post subject: |
 |
|
I have updated 15min tf entry rules. It may reduce whipsaws a lot.
rgds
ravee
|
|
| Back to top |
|
 |
ganesh_pl
White Belt

Joined: 15 Aug 2008
Posts: 34
|
Post: #24  Posted: Wed Sep 21, 2011 6:28 pm Post subject: LT 15 MIN Posted: Wed Sep 21, 2011 6:28 pm Post subject: LT 15 MIN |
 |
|
RAVEE,
LT 15min chart candle cross over you took buy or wait for to cross 34 & 65 ema cross over... as per strategy buy/sell if ema crossover side, please explain..
Thanks
|
|
| Back to top |
|
 |
singh.ravee
Yellow Belt

Joined: 12 Aug 2010
Posts: 678
|
Post: #25  Posted: Wed Sep 21, 2011 6:33 pm Post subject: Re: LT 15 MIN Posted: Wed Sep 21, 2011 6:33 pm Post subject: Re: LT 15 MIN |
 |
|
| ganesh_pl wrote: | RAVEE,
LT 15min chart candle cross over you took buy or wait for to cross 34 & 65 ema cross over... as per strategy buy/sell if ema crossover side, please explain..
Thanks |
ganesh_pl
In simpler terms, 34ema was below 65ema in LT 15min, representing downtrend. So the long should have been avoided.
Rgds
Ravee
|
|
| Back to top |
|
 |
Gemini
White Belt

Joined: 28 Apr 2009
Posts: 166
|
Post: #26  Posted: Thu Sep 22, 2011 12:51 pm Post subject: Posted: Thu Sep 22, 2011 12:51 pm Post subject: |
 |
|
Suggest adding one more rule: If there is any signal that gets generated in last 60 minutes of the day, please do not take position, but wait for next days opening range.
(Ref. yesterday's Nifty signal on 30 min tf)
|
|
| Back to top |
|
 |
singh.ravee
Yellow Belt

Joined: 12 Aug 2010
Posts: 678
|
Post: #27  Posted: Thu Sep 22, 2011 12:57 pm Post subject: Posted: Thu Sep 22, 2011 12:57 pm Post subject: |
 |
|
| Gemini wrote: | Suggest adding one more rule: If there is any signal that gets generated in last 60 minutes of the day, please do not take position, but wait for next days opening range.
(Ref. yesterday's Nifty signal on 30 min tf) |
Gemini
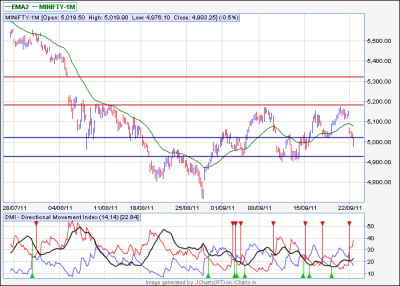
last candle of the day has given signal on 30min, which needs to be followed by triggering of signal, which in this case has not happened.
i have done support and resistance marking on minifty 60min. check it.
the buy signal generated on 30min was quite close to resistance.
rgds
ravee
| Description: |
|
| Filesize: |
29.87 KB |
| Viewed: |
440 Time(s) |
|
|
|
| Back to top |
|
 |
ganesh_pl
White Belt

Joined: 15 Aug 2008
Posts: 34
|
Post: #28  Posted: Thu Sep 22, 2011 5:35 pm Post subject: Posted: Thu Sep 22, 2011 5:35 pm Post subject: |
 |
|
Ravee Bhai,
Yesterday nifty chart 15m, 30m, 60m time frame all the day candles above 34 ema, How u get sell signal... Please explain..
And one more thing 15m yesterday opening candle high crossed by second candle, there we want to go buy means stoploss hit... here we need to wait until second candle close above the previous one to take trade or just cross we initiate trade there.. Please explain..
Thanks
|
|
| Back to top |
|
 |
ganesh_pl
White Belt

Joined: 15 Aug 2008
Posts: 34
|
Post: #29  Posted: Thu Sep 22, 2011 5:38 pm Post subject: Posted: Thu Sep 22, 2011 5:38 pm Post subject: |
 |
|
Ravee bhai,
Now nifty price closed down below the 34 & 65 ema and dmi in -ve, so tomorrow how we intiate fresh trade ....
|
|
| Back to top |
|
 |
singh.ravee
Yellow Belt

Joined: 12 Aug 2010
Posts: 678
|
Post: #30  Posted: Thu Sep 22, 2011 8:38 pm Post subject: Posted: Thu Sep 22, 2011 8:38 pm Post subject: |
 |
|
| ganesh_pl wrote: | Ravee bhai,
Now nifty price closed down below the 34 & 65 ema and dmi in -ve, so tomorrow how we intiate fresh trade .... |
ganesh_pl
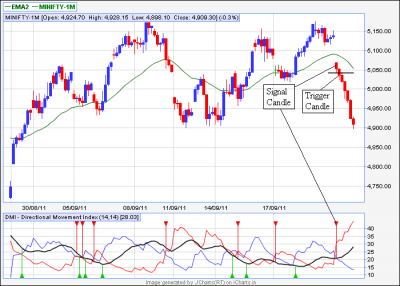
pl have a look at chart of mnf 60min. the story of nf will be same. the short was triggered today itself.
in 60min use only 34ema. its sufficient.
regards
ravee
| Description: |
|
| Filesize: |
38.35 KB |
| Viewed: |
487 Time(s) |
|
|
|
| Back to top |
|
 |
|

