| View previous topic :: View next topic |
| Author |
Swing Trading using DMI n EMA |
svkum
White Belt

Joined: 14 Feb 2007
Posts: 321
|
Post: #46  Posted: Sat Sep 24, 2011 12:19 am Post subject: Posted: Sat Sep 24, 2011 12:19 am Post subject: |
 |
|
singh,
you have guided us for entry , but not for exit,
we become abhmanyus, know , how to enter , but not exit, we may be trapped. 
|
|
| Back to top |
|
 |
|
|
 |
singh.ravee
Yellow Belt

Joined: 12 Aug 2010
Posts: 678
|
Post: #47  Posted: Sat Sep 24, 2011 8:50 am Post subject: Posted: Sat Sep 24, 2011 8:50 am Post subject: |
 |
|
I have updated the method for 15min tf also. Added few points on tsl and exit and some observational points.
svkum sir, i hope it suffice as far as ur query is concerned.
sambhaji_t, kindly apply 170ema along with 34 ema on sbin 15min. you will understand why my immediate reaction was assertive.
Any suggestions to improve method are welcome. please feel free to share.
rgds
ravee
|
|
| Back to top |
|
 |
opportunist
White Belt

Joined: 27 Apr 2010
Posts: 356
|
Post: #48  Posted: Sat Sep 24, 2011 6:55 pm Post subject: Posted: Sat Sep 24, 2011 6:55 pm Post subject: |
 |
|
| svkum wrote: | singh,
you have guided us for entry , but not for exit,
we become abhmanyus, know , how to enter , but not exit, we may be trapped.  |
Very well said Svkum Sir.....most of us are abhimanyu's
   
Few guys elaborate on exit whereas the trading universe is full of entry strategies
|
|
| Back to top |
|
 |
sambhaji_t
White Belt

Joined: 31 Mar 2008
Posts: 135
|
Post: #49  Posted: Sat Sep 24, 2011 9:26 pm Post subject: Posted: Sat Sep 24, 2011 9:26 pm Post subject: |
 |
|
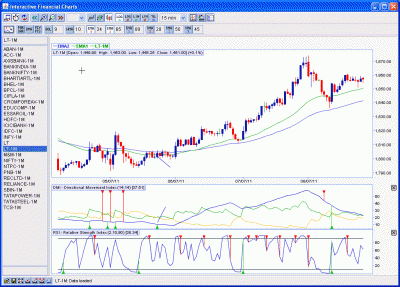
Dear Ravee ,
Please tell where is the exact entry point as per our system for the following chart.
Thanks in advance.
| Description: |
|
| Filesize: |
51.67 KB |
| Viewed: |
434 Time(s) |
|
|
|
| Back to top |
|
 |
singh.ravee
Yellow Belt

Joined: 12 Aug 2010
Posts: 678
|
Post: #50  Posted: Sat Sep 24, 2011 10:10 pm Post subject: Posted: Sat Sep 24, 2011 10:10 pm Post subject: |
 |
|
| sambhaji_t wrote: | Dear Ravee ,
Please tell where is the exact entry point as per our system for the following chart.
Thanks in advance. |
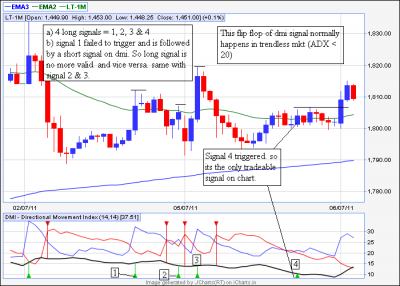
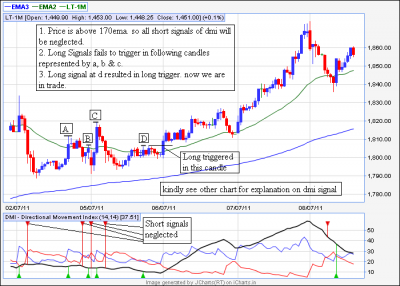
sambhaji_t,
thanks for posting this chart. the explanation will touch most of the things.
kindly use 34ema and 170ema in 15min chart.
Although I have tried to capture all on charts. Still feel free to ask.
Thanks and Regards
Ravee
| Description: |
|
| Filesize: |
37.42 KB |
| Viewed: |
464 Time(s) |
|
| Description: |
|
| Filesize: |
38.31 KB |
| Viewed: |
478 Time(s) |
|
|
|
| Back to top |
|
 |
sambhaji_t
White Belt

Joined: 31 Mar 2008
Posts: 135
|
Post: #51  Posted: Sat Sep 24, 2011 10:59 pm Post subject: Posted: Sat Sep 24, 2011 10:59 pm Post subject: |
 |
|
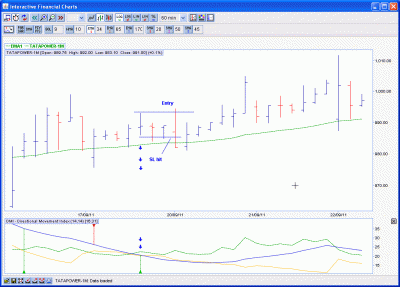
Ravee,
Is it valid trade on 60TF ? if so when to re-enter ?
| Description: |
|
| Filesize: |
33.07 KB |
| Viewed: |
414 Time(s) |
|
|
|
| Back to top |
|
 |
singh.ravee
Yellow Belt

Joined: 12 Aug 2010
Posts: 678
|
Post: #52  Posted: Sun Sep 25, 2011 12:43 am Post subject: Posted: Sun Sep 25, 2011 12:43 am Post subject: |
 |
|
| sambhaji_t wrote: | Ravee,
Is it valid trade on 60TF ? if so when to re-enter ? |
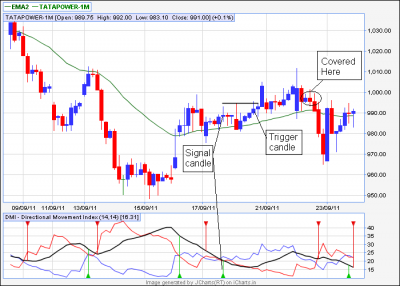
sambhaji_t
i checked the chart and i will give it a pass for following reasons
1. The buy signal when came, adx was falling. Its better to ignore these signals. Better signals are when adx is below 20
2. The high of candle is 992.95. I always add some margin to the price level. I would have put buy at 995. The candle marked by you has high at 994.5
Check my chart, I would have covered position as soon as adx turns down. Probably a npnl trade.
thanks and regards
ravee
| Description: |
|
| Filesize: |
37.87 KB |
| Viewed: |
458 Time(s) |
|
|
|
| Back to top |
|
 |
Gemini
White Belt

Joined: 28 Apr 2009
Posts: 166
|
Post: #53  Posted: Tue Sep 27, 2011 11:04 am Post subject: Posted: Tue Sep 27, 2011 11:04 am Post subject: |
 |
|
This method has given some good winners like Bharti, SBI etc. yesterday. Sincere thanks.
What is the feedback on Axis bank ? Will we consider as a valid buy if the prioce crosses ema34 again when the DMI is in buy state?
|
|
| Back to top |
|
 |
singh.ravee
Yellow Belt

Joined: 12 Aug 2010
Posts: 678
|
Post: #54  Posted: Tue Sep 27, 2011 11:59 am Post subject: Posted: Tue Sep 27, 2011 11:59 am Post subject: |
 |
|
gemini,
on 15min axis bank, 34 ema is below 170ema, so we will neglect all long signals.
on 60min no fresh signal on dmi as of now.
pl note that buy or sell signals are taken only when di lines crossover happen.
price moving above/below 34ema is supporting condition.
wish u profitable trading.
regards
ravee
|
|
| Back to top |
|
 |
singh.ravee
Yellow Belt

Joined: 12 Aug 2010
Posts: 678
|
Post: #55  Posted: Tue Sep 27, 2011 12:09 pm Post subject: Posted: Tue Sep 27, 2011 12:09 pm Post subject: |
 |
|
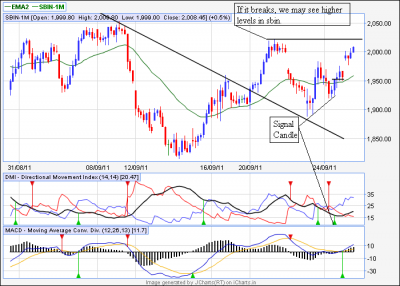
sbin 60min chart
rgds
ravee
| Description: |
|
| Filesize: |
45.75 KB |
| Viewed: |
461 Time(s) |
|
|
|
| Back to top |
|
 |
imbst
White Belt

Joined: 23 May 2010
Posts: 86
|
Post: #56  Posted: Tue Sep 27, 2011 1:34 pm Post subject: Re: BHEL Posted: Tue Sep 27, 2011 1:34 pm Post subject: Re: BHEL |
 |
|
Dear Sir,
May u pls. explain what do you mean by golden crossover and dead crossover, as u mentioned. I am new to TA.
Best Regards
|
|
| Back to top |
|
 |
Gemini
White Belt

Joined: 28 Apr 2009
Posts: 166
|
Post: #57  Posted: Tue Sep 27, 2011 1:38 pm Post subject: Posted: Tue Sep 27, 2011 1:38 pm Post subject: |
 |
|
Thanks Dear Ravee for response and SBI chart.
Just to share, I have applied this system on 30 min TF ( DMI and ema34) and fould the same to be providing good results. I track only a few stocks and execute only after the signal candle is complete.
Your other inouts are also quite valuable. (ADX slope, DMI strength etc.).
Combined with ema34 rejection, the set-up at ema34 is turning out to be quite interesting. I have also studied Traders Action Zone concept and found the same to be useful (have checked on eod basis) .
Happy Trading 
|
|
| Back to top |
|
 |
singh.ravee
Yellow Belt

Joined: 12 Aug 2010
Posts: 678
|
Post: #58  Posted: Tue Sep 27, 2011 2:05 pm Post subject: Re: BHEL Posted: Tue Sep 27, 2011 2:05 pm Post subject: Re: BHEL |
 |
|
| akhterasif1 wrote: | Dear Sir,
May u pls. explain what do you mean by golden crossover and dead crossover, as u mentioned. I am new to TA.
Best Regards |
akhterasif1,
golden crossover = DI+ line moves above DI- line
dead crossover = DI+ line moves below DI- line.
rgds
ravee
|
|
| Back to top |
|
 |
imbst
White Belt

Joined: 23 May 2010
Posts: 86
|
Post: #59  Posted: Tue Sep 27, 2011 2:13 pm Post subject: Re: BHEL Posted: Tue Sep 27, 2011 2:13 pm Post subject: Re: BHEL |
 |
|
| singh.ravee wrote: | | akhterasif1 wrote: | Dear Sir,
May u pls. explain what do you mean by golden crossover and dead crossover, as u mentioned. I am new to TA.
Best Regards |
akhterasif1,
golden crossover = DI+ line moves above DI- line
dead crossover = DI+ line moves below DI- line.
rgds
ravee |
|
|
| Back to top |
|
 |
imbst
White Belt

Joined: 23 May 2010
Posts: 86
|
Post: #60  Posted: Tue Sep 27, 2011 2:15 pm Post subject: Re: BHEL Posted: Tue Sep 27, 2011 2:15 pm Post subject: Re: BHEL |
 |
|
| akhterasif1 wrote: | | singh.ravee wrote: | | akhterasif1 wrote: | Dear Sir,
May u pls. explain what do you mean by golden crossover and dead crossover, as u mentioned. I am new to TA.
Best Regards |
akhterasif1,
golden crossover = DI+ line moves above DI- line
dead crossover = DI+ line moves below DI- line.
rgds
ravee |
|
Thanxz a lot Mr.Ravee,
God Bless you
|
|
| Back to top |
|
 |
|

