| View previous topic :: View next topic |
| Author |
Swing Trading using DMI n EMA |
singh.ravee
Yellow Belt

Joined: 12 Aug 2010
Posts: 678
|
Post: #61  Posted: Tue Sep 27, 2011 3:00 pm Post subject: Re: BHEL Posted: Tue Sep 27, 2011 3:00 pm Post subject: Re: BHEL |
 |
|
| akhterasif1 wrote: |
God Bless you |
May god bless all. 
|
|
| Back to top |
|
 |
|
|
|
Gemini
White Belt

Joined: 28 Apr 2009
Posts: 166
|
| Post: #62 Posted: Thu Sep 29, 2011 1:18 pm Post subject: |
|
|
HDFC Ltd has given buy signal (60 min TF) with Trigger proice of 647 and SL of 637 In sept contract). Plan to carry Oct Long till the first sell signal comes up (-ve crossing of ema34 or sell indicator on DMI lines).
Similar indicaton has come up for ICICI bank...
|
|
| Back to top |
|
|
singh.ravee
Yellow Belt
Joined: 12 Aug 2010
Posts: 678
|
| Post: #63 Posted: Thu Sep 29, 2011 4:16 pm Post subject: |
|
|
gemini,

for 60min i personally take trade where sl =< 1% of price. again its personal choice.
wish u all success
rgds
ravee
|
|
| Back to top |
|
|
singh.ravee
Yellow Belt
Joined: 12 Aug 2010
Posts: 678
|
| Post: #64 Posted: Fri Sep 30, 2011 9:12 am Post subject: |
|
|
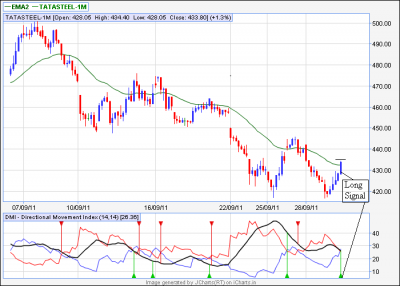
tatasteel -1m 60min. Long signal in chart.
rgds
ravee
| Description: |
|
| Filesize: |
36.53 KB |
| Viewed: |
473 Time(s) |
|
|
|
| Back to top |
|
|
maooliservice
White Belt
Joined: 04 Aug 2010
Posts: 93
|
| Post: #65 Posted: Fri Sep 30, 2011 10:21 am Post subject: |
|
|
Dear Singh.Ravee
Nifty 15m tft as per 170/34 Ema it is showing bullish.But on the 1st
candle golden crossover is there and 34ema downside candle close is also
there.So should we take short trade. If so at what price.
Regards
Mohan
|
|
| Back to top |
|
|
singh.ravee
Yellow Belt
Joined: 12 Aug 2010
Posts: 678
|
| Post: #66 Posted: Fri Sep 30, 2011 10:26 am Post subject: |
|
|
| maooliservice wrote: | Dear Singh.Ravee
Nifty 15m tft as per 170/34 Ema it is showing bullish.But on the 1st
candle golden crossover is there and 34ema downside candle close is also
there.So should we take short trade. If so at what price.
Regards
Mohan |
Mohan ji,
We will not take short trade as 34ema is above 170ema and close coincides with 34ema.
Thanks and Regards
Ravee
|
|
| Back to top |
|
|
maooliservice
White Belt
Joined: 04 Aug 2010
Posts: 93
|
| Post: #67 Posted: Fri Sep 30, 2011 11:07 am Post subject: |
|
|
Dear Ravee
Thanks
Regards
Mohan
|
|
| Back to top |
|
|
Gemini
White Belt
Joined: 28 Apr 2009
Posts: 166
|
| Post: #68 Posted: Fri Sep 30, 2011 11:08 am Post subject: |
|
|
Dear Ravee,
Advise of not taking short in Nifty was quite useful.
Nifty has provided buy signal in 30 min TF. I know that the you follow 15 min and 60 min, but thoughyt of sharing.
Thanks for sharing useful nuggets (like personal choice of SL to be < 1 %)
|
|
| Back to top |
|
|
vinay28
Black Belt

Joined: 24 Dec 2010
Posts: 11748
|
| Post: #69 Posted: Fri Sep 30, 2011 12:06 pm Post subject: |
|
|
| Is nifty still in buy?
|
|
| Back to top |
|
|
Gemini
White Belt
Joined: 28 Apr 2009
Posts: 166
|
| Post: #70 Posted: Fri Sep 30, 2011 1:12 pm Post subject: |
|
|
On 30 min chart, Nifty is side-ways and gave DMI crossover for sell. However, I have not taken that call as Candle did not close below ema 34. I am still holfing long.
Nifty gave buy in 60 min TF yesterday and that signal is still valid in 60 min TF.
I do not advise fresh buy as fresh DMI crossover has still not happened.
|
|
| Back to top |
|
|
vinay28
Black Belt
Joined: 24 Dec 2010
Posts: 11748
|
| Post: #71 Posted: Fri Sep 30, 2011 1:18 pm Post subject: |
|
|
| Thanks
|
|
| Back to top |
|
|
singh.ravee
Yellow Belt
Joined: 12 Aug 2010
Posts: 678
|
| Post: #72 Posted: Fri Sep 30, 2011 3:58 pm Post subject: |
|
|
Kindly see the attached chart for times when adx line moves below both di lines.
rgds
ravee
| Description: |
|
| Filesize: |
42.24 KB |
| Viewed: |
564 Time(s) |

|
|
|
| Back to top |
|
|
singh.ravee
Yellow Belt
Joined: 12 Aug 2010
Posts: 678
|
| Post: #73 Posted: Sat Oct 01, 2011 7:29 pm Post subject: |
|
|
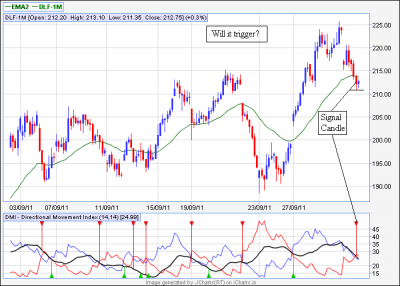
dlf 60min chart.
rgds
ravee
| Description: |
|
| Filesize: |
40.99 KB |
| Viewed: |
479 Time(s) |
|
|
|
| Back to top |
|
|
ganesh_pl
White Belt
Joined: 15 Aug 2008
Posts: 34
|
| Post: #74 Posted: Sun Oct 02, 2011 11:26 am Post subject: CONGESTION BREAKOUT? |
|
|
Dear Ravee,
Please explain congestion breakout....
|
|
| Back to top |
|
|
singh.ravee
Yellow Belt
Joined: 12 Aug 2010
Posts: 678
|
| Post: #75 Posted: Sun Oct 02, 2011 11:30 am Post subject: Re: CONGESTION BREAKOUT? |
|
|
| ganesh_pl wrote: | Dear Ravee,
Please explain congestion breakout.... |
ganesh_pl,
like sbin and bnf are rangebound these days, one can enter once they break this congestion zone
kindly read this thread. its complete in itself
http://www.icharts.in/forum/a-laymans-approach-to-break-out-and-break-down-t2878.html
if u have any specific chart in ur mind. pl post.
rgds
ravee
|
|
| Back to top |
|
|
|


