| View previous topic :: View next topic |
| Author |
Swing Trading using DMI n EMA |
maooliservice
White Belt

Joined: 04 Aug 2010
Posts: 93
|
Post: #76  Posted: Sun Oct 02, 2011 6:13 pm Post subject: Posted: Sun Oct 02, 2011 6:13 pm Post subject: |
 |
|
Dear Ravee,
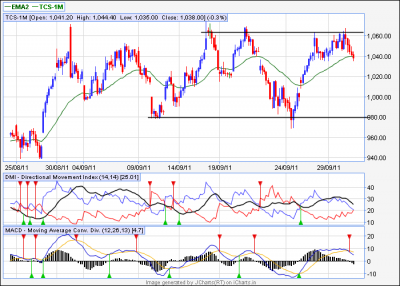
TCS future is about to give short .Pls let me know is it ok or not
Regards
Mohan
|
|
| Back to top |
|
 |
|
|
 |
singh.ravee
Yellow Belt

Joined: 12 Aug 2010
Posts: 678
|
Post: #77  Posted: Sun Oct 02, 2011 9:56 pm Post subject: Posted: Sun Oct 02, 2011 9:56 pm Post subject: |
 |
|
| maooliservice wrote: | Dear Ravee,
TCS future is about to give short .Pls let me know is it ok or not
Regards
Mohan |
Mohan,
di crossover is still awaited. as stock is in congestion zone. a short with tgt of lower line can be taken if appropriate entry is found
regards
ravee
| Description: |
|
| Filesize: |
31.85 KB |
| Viewed: |
475 Time(s) |
|
|
|
| Back to top |
|
 |
newinvestor
White Belt

Joined: 16 Feb 2010
Posts: 120
|
Post: #78  Posted: Wed Oct 12, 2011 8:09 am Post subject: Posted: Wed Oct 12, 2011 8:09 am Post subject: |
 |
|
Hi Ravee. On Nifty, we had a Short Signal yesterday in 15 TF. Lets see how the trade performs today.
Which other stocks are you tracking now based on this system?
|
|
| Back to top |
|
 |
singh.ravee
Yellow Belt

Joined: 12 Aug 2010
Posts: 678
|
Post: #79  Posted: Wed Oct 12, 2011 8:55 am Post subject: Posted: Wed Oct 12, 2011 8:55 am Post subject: |
 |
|
| newinvestor wrote: | Hi Ravee. On Nifty, we had a Short Signal yesterday in 15 TF. Lets see how the trade performs today.
Which other stocks are you tracking now based on this system? |
newinvestor,
hello. in nf-15min 34ema is above 170ema so short signals of dmi will be neglected per se.
these days i m tracking nf, bnf, ril, rec and hindalco
rgds
ravee
|
|
| Back to top |
|
 |
singh.ravee
Yellow Belt

Joined: 12 Aug 2010
Posts: 678
|
Post: #80  Posted: Thu Oct 20, 2011 9:19 pm Post subject: Posted: Thu Oct 20, 2011 9:19 pm Post subject: |
 |
|
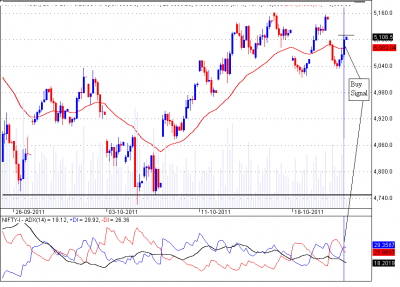
buy signal in nf-1m. lets wait for trigger.
rgds
ravee
| Description: |
|
| Filesize: |
33.74 KB |
| Viewed: |
491 Time(s) |
|
|
|
| Back to top |
|
 |
Gemini
White Belt

Joined: 28 Apr 2009
Posts: 166
|
Post: #81  Posted: Fri Dec 02, 2011 4:34 pm Post subject: Feedback on ema34 / DMI Xover Posted: Fri Dec 02, 2011 4:34 pm Post subject: Feedback on ema34 / DMI Xover |
 |
|
I have ben following this strategy on 60 min TF on selected stocks (top 20 of nifty index and a few midcaps) for over a month now. Results have been quite encouraging.
I have noted the folloowing:
1. Keeping initial SL for muktiple days provides better returns (though a little bit high risk).
2. For high liquid stocks, the big boys of the market make the scrip move below initial SL in first hour after the signal has triggered, thus "shaking" the tree and picking up positions at good bargain !
Thanks Ravee for sharing the strategy. Happy Trading to all...
|
|
| Back to top |
|
 |
newinvestor
White Belt

Joined: 16 Feb 2010
Posts: 120
|
Post: #82  Posted: Fri Dec 02, 2011 5:38 pm Post subject: Posted: Fri Dec 02, 2011 5:38 pm Post subject: |
 |
|
Although I have not used this strategy in trading, it looks sensible.
Gemini, if you dont mind, can you share which stocks were more suited to this strategy, and which ones you felt most at risk?
Also, what do you mean by waiting for multiple days SL?
|
|
| Back to top |
|
 |
singh.ravee
Yellow Belt

Joined: 12 Aug 2010
Posts: 678
|
Post: #83  Posted: Fri Dec 02, 2011 5:41 pm Post subject: Posted: Fri Dec 02, 2011 5:41 pm Post subject: |
 |
|
Gemini,
Hello,
Congratulation to you for your efforts.
Kindly share any one chart elaborating your point.
I am using it in 5min time frame too with one modification. This modification works well with shorter time frame.
Wish u all success.
Regards
Ravee
|
|
| Back to top |
|
 |
nanchilvijay
White Belt

Joined: 13 Jun 2007
Posts: 26
|
Post: #84  Posted: Sat Dec 03, 2011 2:50 am Post subject: Posted: Sat Dec 03, 2011 2:50 am Post subject: |
 |
|
can bit map be posted here?
nanchilvijay
|
|
| Back to top |
|
 |
Gemini
White Belt

Joined: 28 Apr 2009
Posts: 166
|
Post: #85  Posted: Sat Dec 03, 2011 5:21 pm Post subject: Examples Posted: Sat Dec 03, 2011 5:21 pm Post subject: Examples |
 |
|
Thanks Ravee.
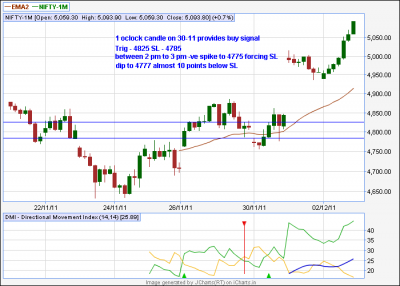
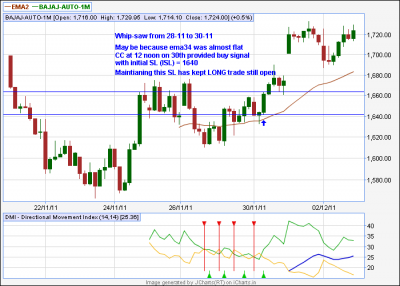
Posting two examples. Bajaj Auto chart shows how maintaining initial SL has kept trade open for possible larger gain.
Nifty chart indicates how market had a negative spike (only for 30 min) to force the SL.
I am keen to understand how this method can be deployed in 5 min TF.
For SL, I have observed that for carry-over trade, one can use Opening range high and Low (for the first candle i.e. 10 am closing) for keeping SL.
Happy Sharing and happy trading... 
| Description: |
|
| Filesize: |
19.56 KB |
| Viewed: |
478 Time(s) |
|
| Description: |
|
| Filesize: |
20.01 KB |
| Viewed: |
455 Time(s) |
|
|
|
| Back to top |
|
 |
singh.ravee
Yellow Belt

Joined: 12 Aug 2010
Posts: 678
|
Post: #86  Posted: Sat Dec 03, 2011 6:56 pm Post subject: Posted: Sat Dec 03, 2011 6:56 pm Post subject: |
 |
|
Gemini,
Hello,
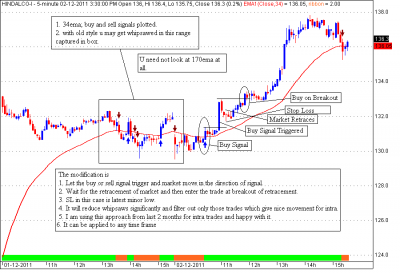
Thanks for posting the chart.
I got ur point. The attached chart is self explanatory.
Happie Trading to you also
Regards
Ravee
| Description: |
|
| Filesize: |
35.44 KB |
| Viewed: |
592 Time(s) |
|
|
|
| Back to top |
|
 |
girishhu1
White Belt

Joined: 17 Aug 2009
Posts: 316
|
Post: #87  Posted: Sun Dec 04, 2011 10:01 am Post subject: Posted: Sun Dec 04, 2011 10:01 am Post subject: |
 |
|
hi singh.ravee
thanks for sharing such a nice strategy.
and congrats for such a beautiful thread
one doubt-you mentioned 2 timeframes in your set up- 60m,15m
15m tf used for guaging the trend from the position of 34/170 ema
but generally a trade is taken in the direction of longer tf trend- here 60m tf
so is this strategy designed for taking contra trend trades?
regards
girish
|
|
| Back to top |
|
 |
singh.ravee
Yellow Belt

Joined: 12 Aug 2010
Posts: 678
|
Post: #88  Posted: Sun Dec 04, 2011 10:09 am Post subject: Posted: Sun Dec 04, 2011 10:09 am Post subject: |
 |
|
| girishhu1 wrote: |
one doubt-you mentioned 2 timeframes in your set up- 60m,15m
15m tf used for guaging the trend from the position of 34/170 ema
but generally a trade is taken in the direction of longer tf trend- here 60m tf
so is this strategy designed for taking contra trend trades?
regards
girish |
girishhu1,
hello,
its a trend trading only. It can be applied to any timeframe.
if one is taking entry as per hindalco 5min chart then no need to look at 170ema or higher tf. Its purely intra trade with targets of approx 1% of price.
In other words I have omitted use of 170ema in lower timeframes and in higher tf 170ema was not required at all.
For swing use 60min tf.
I need to update, first post of the thread 
thanks and regards
ravee
|
|
| Back to top |
|
 |
singh.ravee
Yellow Belt

Joined: 12 Aug 2010
Posts: 678
|
Post: #89  Posted: Sun Dec 04, 2011 12:33 pm Post subject: Posted: Sun Dec 04, 2011 12:33 pm Post subject: |
 |
|
strategy updated in the first post of thread 
rgds
ravee
|
|
| Back to top |
|
 |
singh.ravee
Yellow Belt

Joined: 12 Aug 2010
Posts: 678
|
Post: #90  Posted: Mon Dec 05, 2011 1:18 pm Post subject: Posted: Mon Dec 05, 2011 1:18 pm Post subject: |
 |
|
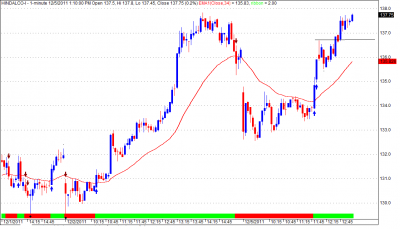
intraday trade in hindalco 5min.
rgds
ravee
| Description: |
|
| Filesize: |
34.14 KB |
| Viewed: |
433 Time(s) |
|
|
|
| Back to top |
|
 |
|

