|
|
| View previous topic :: View next topic |
| Author |
Swing Trading using DMI n EMA |
singh.ravee
Yellow Belt

Joined: 12 Aug 2010
Posts: 678
|
Post: #1  Posted: Fri Sep 16, 2011 3:56 pm Post subject: Swing Trading using DMI n EMA Posted: Fri Sep 16, 2011 3:56 pm Post subject: Swing Trading using DMI n EMA |
 |
|
Prerequisites
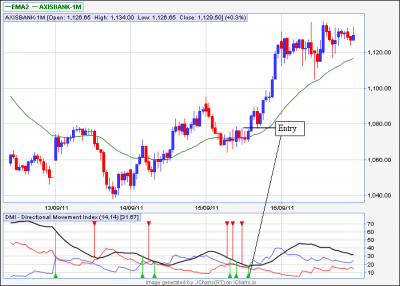
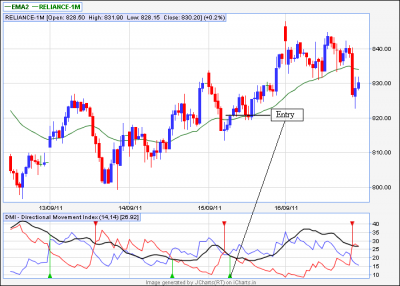
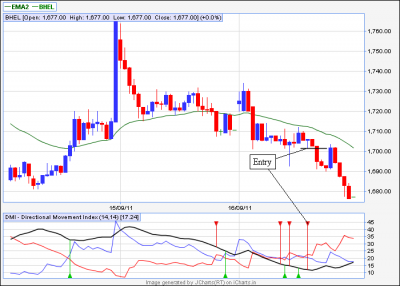
1. TF= 15min, 34ema, 136ema and DMI indicator with default settings.
2. It can be used for any time frame. Only thing is that higher ema needs to be adjusted accordingly
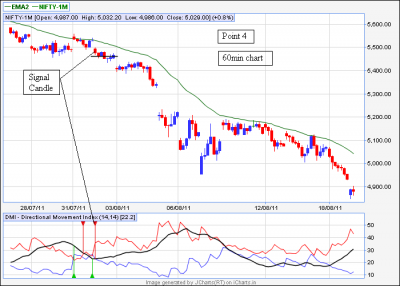
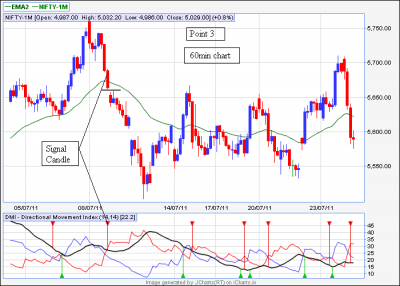
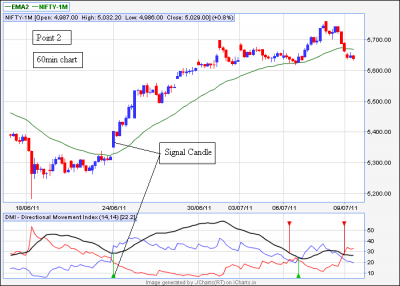
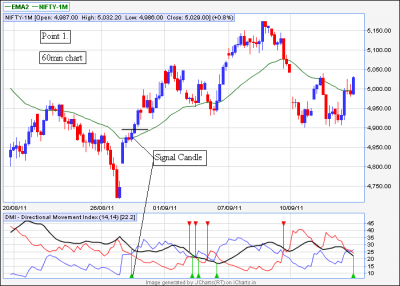
Buy Signal = DI Lines Golden Crossover + candle closes above 34ema.
Sell Signal = DI Lines Dead Crossover + candle closes below 34ema.
Methodology
When 34ema > 136ema
1. Buy Signal:-
Buy = Above the high of signal candle.
Stop Loss = Latest Minor Low.
2. Sell Signal:- Take this sell signal only if candle closes below both 34ema and 136ema.
Sell = Below the low of signal candle.
Stop Loss = Latest Minor High.
When 34ema < 136ema
1. Sell Signal:-
Sell = Below the low of signal candle.
Stop Loss = Latest Minor High.
2. Buy Signal:- Take this buy signal only if candle closes above both 34ema and 136ema.
Buy = Above the high of signal candle.
Stop Loss = Latest Minor Low.
When 34ema n 136ema are entangled
In this case trade first retracement breakout of buy signal and trade first retracement breakdown of sell signal with stop at latest minor low and latest minor high respectively.
For Exits and Trailing Stop Loss = Use your own method based upon risk tolerance and money management techniques.
Few things that can be considered for TSL or exit
1. Elder safezone stoploss.
2. Alligator red line
3. SSPS 0.5*ATR
Last edited by singh.ravee on Fri May 04, 2012 8:56 am; edited 9 times in total |
|
| Back to top |
|
 |
|
|  |
singh.ravee
Yellow Belt

Joined: 12 Aug 2010
Posts: 678
|
Post: #2  Posted: Fri Sep 16, 2011 4:07 pm Post subject: Examples Posted: Fri Sep 16, 2011 4:07 pm Post subject: Examples |
 |
|
Entries on nifty future-1m in 60min is marked on charts. The name of charts are self explanatory.
Regards
Ravee
| Description: |
|
| Filesize: |
36.04 KB |
| Viewed: |
869 Time(s) |
|
| Description: |
|
| Filesize: |
39.03 KB |
| Viewed: |
707 Time(s) |
|
| Description: |
|
| Filesize: |
33.93 KB |
| Viewed: |
628 Time(s) |
|
| Description: |
|
| Filesize: |
36.8 KB |
| Viewed: |
688 Time(s) |
|
|
|
| Back to top |
|
 |
singh.ravee
Yellow Belt

Joined: 12 Aug 2010
Posts: 678
|
Post: #3  Posted: Fri Sep 16, 2011 4:52 pm Post subject: axisbank-1m Posted: Fri Sep 16, 2011 4:52 pm Post subject: axisbank-1m |
 |
|
Hi,
The trade entry marked on axisbank-1m in 15min chart.
regards
ravee
| Description: |
|
| Filesize: |
31.27 KB |
| Viewed: |
609 Time(s) |
|
|
|
| Back to top |
|
 |
singh.ravee
Yellow Belt

Joined: 12 Aug 2010
Posts: 678
|
Post: #4  Posted: Fri Sep 16, 2011 4:56 pm Post subject: reliance-1m Posted: Fri Sep 16, 2011 4:56 pm Post subject: reliance-1m |
 |
|
hi,
trade entry on reliance-1m 15min
regards
ravee
| Description: |
|
| Filesize: |
35.45 KB |
| Viewed: |
588 Time(s) |
|
|
|
| Back to top |
|
 |
singh.ravee
Yellow Belt

Joined: 12 Aug 2010
Posts: 678
|
Post: #5  Posted: Fri Sep 16, 2011 5:00 pm Post subject: BHEL Posted: Fri Sep 16, 2011 5:00 pm Post subject: BHEL |
 |
|
Hi,
Short entry in BHEL 15min
Regards
Ravee
| Description: |
|
| Filesize: |
29.47 KB |
| Viewed: |
547 Time(s) |
|
|
|
| Back to top |
|
 |
ramamoorthi
White Belt

Joined: 08 May 2011
Posts: 101
|
Post: #6  Posted: Fri Sep 16, 2011 6:48 pm Post subject: Posted: Fri Sep 16, 2011 6:48 pm Post subject: |
 |
|
EXPERT PLZ COMMENT ABOUT,,,,,,,,,,CHAMBAL FERT CURRENT RATE RS 106
KINDLY COMMENT THIS MONTH EXPIRY TARGET,,,
RAMAMOORTHI

|
|
| Back to top |
|
 |
newinvestor
White Belt

Joined: 16 Feb 2010
Posts: 120
|
Post: #7  Posted: Fri Sep 16, 2011 6:49 pm Post subject: Posted: Fri Sep 16, 2011 6:49 pm Post subject: |
 |
|
Looks good, Ravee Bhai.
What do you mean by DI Golden crossover? Long when the Green goes above the Red?
What about the Black line? Whats its implication? Do you take a trade only when it is above 20 etc?
Do we need to exit the Longs (Stop Loss) if the price falls below the low of the Candle only if the Red DMI line has also crossed below the green line?
Have you tried this on Nifty?
Thanks in advance
|
|
| Back to top |
|
 |
ramamoorthi
White Belt

Joined: 08 May 2011
Posts: 101
|
Post: #8  Posted: Fri Sep 16, 2011 6:56 pm Post subject: Posted: Fri Sep 16, 2011 6:56 pm Post subject: |
 |
|
EXPERT PLZ COMMENT ABOUT,,,,,,,,,,CHAMBAL FERT CURRENT RATE RS 106
KINDLY COMMENT THIS MONTH EXPIRY TARGET,,,
RAMAMOORTHI
|
|
| Back to top |
|
 |
singh.ravee
Yellow Belt

Joined: 12 Aug 2010
Posts: 678
|
Post: #9  Posted: Fri Sep 16, 2011 7:14 pm Post subject: Posted: Fri Sep 16, 2011 7:14 pm Post subject: |
 |
|
| newinvestor wrote: |
What do you mean by DI Golden crossover? Long when the Green goes above the Red?
What about the Black line? Whats its implication? Do you take a trade only when it is above 20 etc?
Do we need to exit the Longs (Stop Loss) if the price falls below the low of the Candle only if the Red DMI line has also crossed below the green line?
Have you tried this on Nifty? |
newinvestor, hello,
di golden crossover = when +di line crosses above -di line
black line = ADX line = per se use is limited.
if -di line crosses below +di line = long side play.
yes, its tested on nifty-1m in 15min, 60min, and eod tf.
hope it suffice.
thanks and regards
ravee
|
|
| Back to top |
|
 |
singh.ravee
Yellow Belt

Joined: 12 Aug 2010
Posts: 678
|
Post: #10  Posted: Fri Sep 16, 2011 7:19 pm Post subject: Posted: Fri Sep 16, 2011 7:19 pm Post subject: |
 |
|
| ramamoorthi wrote: | EXPERT PLZ COMMENT ABOUT,,,,,,,,,,CHAMBAL FERT CURRENT RATE RS 106
KINDLY COMMENT THIS MONTH EXPIRY TARGET,,,
RAMAMOORTHI |
ramamoorthi,
i m still a newbie.
target prediction is not my cup of tea. otherwise the system has given a sell around 108.5
thanks and regards
ravee
|
|
| Back to top |
|
 |
newinvestor
White Belt

Joined: 16 Feb 2010
Posts: 120
|
Post: #11  Posted: Sat Sep 17, 2011 12:00 am Post subject: Posted: Sat Sep 17, 2011 12:00 am Post subject: |
 |
|
Thanks .
How do you determine if the Stock is in a trend on EOD? The ADX helps, or do you use anything else?
|
|
| Back to top |
|
 |
singh.ravee
Yellow Belt

Joined: 12 Aug 2010
Posts: 678
|
Post: #12  Posted: Sat Sep 17, 2011 8:20 am Post subject: Posted: Sat Sep 17, 2011 8:20 am Post subject: |
 |
|
| newinvestor wrote: | Thanks .
How do you determine if the Stock is in a trend on EOD? The ADX helps, or do you use anything else? |
newinvestor,
i use ema to determine trend.
rgds
ravee
|
|
| Back to top |
|
 |
casper
Green Belt

Joined: 02 Oct 2010
Posts: 1315
|
Post: #13  Posted: Sat Sep 17, 2011 9:30 am Post subject: Posted: Sat Sep 17, 2011 9:30 am Post subject: |
 |
|
| singh.ravee wrote: | | newinvestor wrote: | Thanks .
How do you determine if the Stock is in a trend on EOD? The ADX helps, or do you use anything else? |
newinvestor,
i use ema to determine trend.
rgds
ravee |
paaji plz explain the way u use ema to gauge the trend in a bit details plz
[ 2 o clock/4 o clock and other usage,possibly with some charts]
  
|
|
| Back to top |
|
 |
singh.ravee
Yellow Belt

Joined: 12 Aug 2010
Posts: 678
|
|
| Back to top |
|
 |
Arjun20
Yellow Belt

Joined: 23 Jun 2011
Posts: 945
|
Post: #15  Posted: Sat Sep 17, 2011 11:43 am Post subject: Posted: Sat Sep 17, 2011 11:43 am Post subject: |
 |
|
| singh.ravee wrote: |
yes 2o'clock and 4o'clock do represent the strength of trend.
regards
ravee[/color] |
A bit more @2 and 4 o'clock pls.
|
|
| Back to top |
|
 |
|
|
You cannot post new topics in this forum
You cannot reply to topics in this forum
You cannot edit your posts in this forum
You cannot delete your posts in this forum
You cannot vote in polls in this forum
You can attach files in this forum
You can download files in this forum
|
Powered by phpBB © 2001, 2005 phpBB Group
|
|
|

