| View previous topic :: View next topic |
| Author |
Technical dissection - BANKNIFTY |
RoyalTrader
White Belt

Joined: 31 Oct 2010
Posts: 75
|
Post: #1  Posted: Sun Dec 12, 2010 12:56 pm Post subject: Technical dissection - BANKNIFTY Posted: Sun Dec 12, 2010 12:56 pm Post subject: Technical dissection - BANKNIFTY |
 |
|
Dear WILL2WIN and all friends,
Here comes technical dissection of Bank nifty - A try from my side..
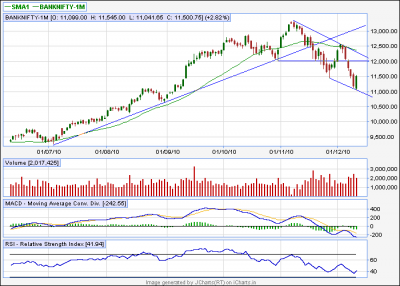
Bank nifty is high beta counter as compared to nifty. It was consistantly helping the nifty to go higher and higher till 8th Nov 2010.
Since then it started underperforming the nifty. This can be easily identified if you analyse both charts at a time...
With Friday and Thursday Banknifty formed a classic bullish piercing pattern..
One can initiate long position in Bank nifty with S/L of support zone 11360-11270 (spot) and a target of 11950 (spot) (as per your risk appetite)
If that is taken out you can get 12850 or even a new high...
Please go through attached chart you will realise the significance of 11950-12000 Level..
Kindly note the chart is of future.. For volume purpose I have to take future chart.
Regards,
RT
| Description: |
|
| Filesize: |
13.83 KB |
| Viewed: |
636 Time(s) |
|
|
|
| Back to top |
|
 |
|
|
|
jjm
White Belt
Joined: 17 Mar 2010
Posts: 411
|
| Post: #2 Posted: Sun Dec 12, 2010 2:08 pm Post subject: WW in bank Nifty |
|
|
Dear Royal,
Hi!
Trust you are aware of WW..will this pattern hold true for Bank nifty... http://www.icharts.in/forum/running-with-the-wolves-t2310.html
If yes, then tgt mentioned by you will be achievable
Let's see...
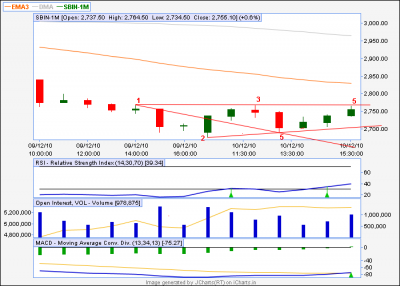
One can initiate long based on this pattern ,,,but not sure what should be the stop loss ideally with stop loss should be just below pt 5 or 20 pts below low of the Friday candle, but it is too much almost 550 pts...
A pt of worry is SBI has formed WW with negative outlook , 60 TF ....attached chart for same
Regards,
JJM
| Description: |
|
| Filesize: |
31.55 KB |
| Viewed: |
577 Time(s) |
|
| Description: |
|
| Filesize: |
38.39 KB |
| Viewed: |
596 Time(s) |
|
|
|
| Back to top |
|
|
jjm
White Belt
Joined: 17 Mar 2010
Posts: 411
|
| Post: #3 Posted: Sun Dec 12, 2010 2:12 pm Post subject: |
|
|
Ooops.. in SBI pt 5 shld be pt 4 i mean a candle closed @ 13 Pm having low of 2690.55

Regards,
JJM
|
|
| Back to top |
|
|
WILL2WIN
White Belt
Joined: 05 Mar 2010
Posts: 51
|
| Post: #4 Posted: Sun Dec 12, 2010 5:45 pm Post subject: |
|
|
RT thanx for the efforts u took to analyse BNF. 11950 seems coming from the charts. Needed confirmation from more avid analysers. Thanx again to you. @ JJM thanx for indicating the WW angle. If the sixth wave tgt is achieved it will be a real nice tribute to woolfwavians. 
|
|
| Back to top |
|
|
RoyalTrader
White Belt
Joined: 31 Oct 2010
Posts: 75
|
| Post: #5 Posted: Sun Dec 12, 2010 6:50 pm Post subject: |
|
|
Dear jjm,
I am aware of WW but never used it to trade..
So it is not right to comment on it, if you are not applying it..
So i request to other experts who are implementing it to comment about banknifty.
Regards,
RT
|
|
| Back to top |
|
|
acharyams
Yellow Belt

Joined: 04 Jul 2010
Posts: 552
|
| Post: #6 Posted: Sun Dec 12, 2010 9:20 pm Post subject: |
|
|
where do you see SBI heading then in this run? 
|
|
| Back to top |
|
|
RoyalTrader
White Belt
Joined: 31 Oct 2010
Posts: 75
|
| Post: #7 Posted: Sun Dec 12, 2010 10:12 pm Post subject: |
|
|
Dear acharyams,
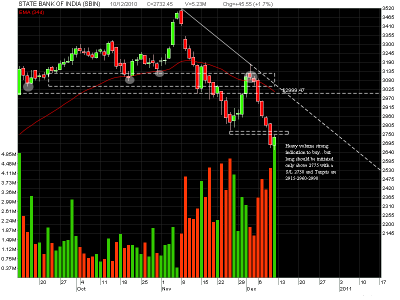
Banking jiant SBI should reach 2915 by 21st Dec as per my analysis..
Please find attached chart for better understanding...
Regards,
RT
| Description: |
|
| Filesize: |
45.02 KB |
| Viewed: |
646 Time(s) |
|
|
|
| Back to top |
|
|
manitrend
White Belt
Joined: 18 Jun 2009
Posts: 2
|
| Post: #8 Posted: Sun Dec 12, 2010 10:41 pm Post subject: Re: WW in bank Nifty |
|
|
| jjm wrote: | Dear Royal,
Hi!
Trust you are aware of WW..will this pattern hold true for Bank nifty... http://www.icharts.in/forum/running-with-the-wolves-t2310.html
If yes, then tgt mentioned by you will be achievable
Let's see...
One can initiate long based on this pattern ,,,but not sure what should be the stop loss ideally with stop loss should be just below pt 5 or 20 pts below low of the Friday candle, but it is too much almost 550 pts...
A pt of worry is SBI has formed WW with negative outlook , 60 TF ....attached chart for same
Regards,
JJM |
Hi
PLz dont mind it but ur wave manual calculation is wrong which u are counting 3,4,5 these are a, b, c hope u got the pattern now. thanks
|
|
| Back to top |
|
|
dcs2247
White Belt
Joined: 17 Mar 2010
Posts: 13
|
| Post: #9 Posted: Sun Dec 12, 2010 11:37 pm Post subject: |
|
|
| RoyalTrader wrote: | Dear acharyams,
Banking jiant SBI should reach 2915 by 21st Dec as per my analysis..
Please find attached chart for better understanding...
Regards,
RT |
|
|
| Back to top |
|
|
sherbaaz
Yellow Belt
Joined: 27 May 2009
Posts: 543
|
| Post: #10 Posted: Sun Dec 12, 2010 11:40 pm Post subject: |
|
|
| dcs2247 wrote: | | RoyalTrader wrote: | Dear acharyams,
Banking jiant SBI should reach 2915 by 21st Dec as per my analysis..
Please find attached chart for better understanding...
Regards,
RT |
|
Hi,
Nice pick. There is a piercing line pattern on Friday. A close above 2766.95 would confirm the same (in its future).
Friday was an up bar and also a strength bar (in cash) with very high volume and also it closed near the high of the day. now since it was a high volume bar closed near the high there is a very good probability that it may reverse from here.
Such high volume with bar closing near the high of the day suggests that SMART MONEY is absorbing the supply means that they are bullish on stock.
Another good thing is that in SBIN FUTURE price rose with rise in OI and a very high volume indicates that there was a fresh buying happened on Friday.
Regards
|
|
| Back to top |
|
|
WILL2WIN
White Belt
Joined: 05 Mar 2010
Posts: 51
|
| Post: #11 Posted: Mon Dec 13, 2010 7:10 am Post subject: |
|
|
@ Sherbaaz that was a nice VSA analysis on SBI. The game is all about SM Smart Money. 
|
|
| Back to top |
|
|
nksachdev
White Belt
Joined: 17 Mar 2009
Posts: 11
|
| Post: #12 Posted: Mon Dec 13, 2010 7:15 am Post subject: bank nifty |
|
|
I wish to add that bn has taken support at 50 % fall of the rise from the low of 25th May.
Juat a strong resistance
|
|
| Back to top |
|
|
RoyalTrader
White Belt
Joined: 31 Oct 2010
Posts: 75
|
| Post: #13 Posted: Mon Dec 13, 2010 8:18 am Post subject: |
|
|
Hi all,
Good to see all around participation.. nice ineteraction..
Thanks for your comments sherbaaz, dcs2247 and nksachdev..
Sherbaaz great explanation.. You exactly wrote what i mean to say.. Thanks for that...
Nksachdev, nice observation..
Keep on posting guys.. It will help me to improve a lot...
Regards,
RT
|
|
| Back to top |
|
|
WILL2WIN
White Belt
Joined: 05 Mar 2010
Posts: 51
|
| Post: #14 Posted: Mon Dec 13, 2010 4:32 pm Post subject: |
|
|
Hammer on EOD but lower than avg vol. Well fought blue red is the winner today. But the bout is not over. Bears will try to pull down tomorrow or at least a narrow range up-bar. May be....'am an amature.  Egarly waiting for more dissection friends. TGT 11950-12150!!!.......comments please RT. Egarly waiting for more dissection friends. TGT 11950-12150!!!.......comments please RT.
|
|
| Back to top |
|
|
RoyalTrader
White Belt
Joined: 31 Oct 2010
Posts: 75
|
| Post: #15 Posted: Mon Dec 13, 2010 8:03 pm Post subject: |
|
|
As sherbaaz mentioned for nifty same applies to bank nifty also..
Here also a " efforts to rise bar" a bullish sign..
Above 11615 (Future).. See fireworks in Banknifty.. No stop till 12000...!!
Just a matter of 1 or 2 days.. once 11615 is taken out..
Enjoy...
Regards,
RT
|
|
| Back to top |
|
|
|


