| View previous topic :: View next topic |
| Author |
Technical dissection - NIFTY |
RoyalTrader
White Belt

Joined: 31 Oct 2010
Posts: 75
|
Post: #1  Posted: Sun Nov 28, 2010 6:48 pm Post subject: Technical dissection - NIFTY Posted: Sun Nov 28, 2010 6:48 pm Post subject: Technical dissection - NIFTY |
 |
|
Dear all,
Kindly go through below attached charts...
Regards,
Royal
| Description: |
|
| Filesize: |
30.28 KB |
| Viewed: |
1075 Time(s) |
|
| Description: |
|
| Filesize: |
56.59 KB |
| Viewed: |
1293 Time(s) |
|
|
|
| Back to top |
|
 |
|
|
|
RoyalTrader
White Belt
Joined: 31 Oct 2010
Posts: 75
|
| Post: #2 Posted: Tue Nov 30, 2010 8:37 am Post subject: |
|
|
Dear all,
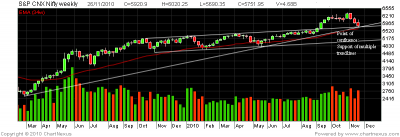
Market rallied yesterday as expected.. it was an upbar i.e. higher high and higher low. Now market is near resistance zone of 5860-5905 if we close in this resistance zone today we can expect 5950 or even 6000 in this week itself. But for that yesterdays low should held out.. if today market goes sideways without making a new high, a test of 5750 or even 5700 is possible..
Volume is a concern but it will come as market starts making higher high and higher lows...
Regards,
Royal
|
|
| Back to top |
|
|
RoyalTrader
White Belt
Joined: 31 Oct 2010
Posts: 75
|
| Post: #3 Posted: Tue Nov 30, 2010 9:02 pm Post subject: |
|
|
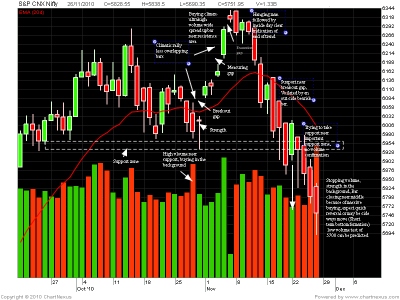
Today market closed in the resistance zone of 5860-5905. As mentioned yesterday volume has started increasing with market making higher high and higher lows each day.. Those who are long from 5780 kind of levels in nifty can look out for 6000 as partial profit booking target.. Market may take a breather around 5970-6030 level, with a view of re-entry around 5930..
The upbar like yesterday and today are often appear near start of medium term uptrend.. But i would like to see a big green candle with 150 points spread (High-Low) and closing near high of the day, as a confirmation that bulls are back... Consertative traders and positional traders can initiate long positions after closing above 6050.
Regards
Royal
|
|
| Back to top |
|
|
RoyalTrader
White Belt
Joined: 31 Oct 2010
Posts: 75
|
| Post: #4 Posted: Wed Dec 01, 2010 9:28 pm Post subject: |
|
|
Today Market gave me that big green candle which I have mentioned in yesterdays post.. Although the spread was not enough long but it is quite healthy to consider.. the closing was also strong, near high of the day..
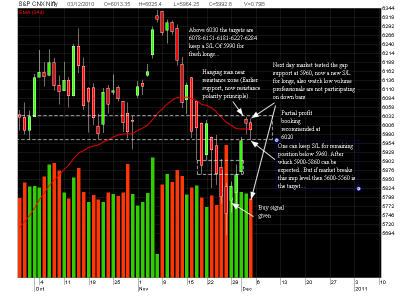
For tomorrow market may open gap up, but it will face strong resistance around 6020-6050 zone.. Hence I would advice those who are long from 5800 to book partial profit around this resistance zone.. Or they can hold with a trailing S/L of 5990 ( I am assuming that tom market will open gap up around 6020 level)..
if market opens flat then you can hold position with a target of 6020, and a S/L of 5940
but if opens gap down below 5940 and trades below 5940 for an hour it is better to exit all your long positions...
Regards,
Royal
|
|
| Back to top |
|
|
rohit44
White Belt
Joined: 05 Jan 2010
Posts: 279
|
| Post: #5 Posted: Wed Dec 01, 2010 10:21 pm Post subject: |
|
|
| nice
|
|
| Back to top |
|
|
nksachdev
White Belt
Joined: 17 Mar 2009
Posts: 11
|
| Post: #6 Posted: Wed Dec 01, 2010 10:28 pm Post subject: time by degrees |
|
|
how many are aware of this.
Pls let me kow and we go forward to understand the same.
|
|
| Back to top |
|
|
RoyalTrader
White Belt
Joined: 31 Oct 2010
Posts: 75
|
| Post: #7 Posted: Wed Dec 01, 2010 10:53 pm Post subject: |
|
|
Dear rohit44,
Thanks for your comments.
Dear nksachdev,
Aware of what? Kindly elaborate..
So that i can help you to understand..
Regards,
Royal.
|
|
| Back to top |
|
|
RoyalTrader
White Belt
Joined: 31 Oct 2010
Posts: 75
|
| Post: #8 Posted: Thu Dec 02, 2010 10:36 pm Post subject: |
|
|
Hi friends,
Today market opened at the exact level which I mentioned yesterday, also it was not able to go above the resistance zone of 6020-6050.. after opening strong, it actually remained in tight range of 5980-6020 and closed in that range.. Now if tomorrow market opens gap up above 6050 one can iniate fresh longs with a S/L of 6000 and a target of 6250-6280...
But if its breaks 5980 it may come down to 5915-5905 support zone..
Between 6050-5980 its a no trade , rangebound zone...
Regards
Royal
|
|
| Back to top |
|
|
nksachdev
White Belt
Joined: 17 Mar 2009
Posts: 11
|
| Post: #9 Posted: Fri Dec 03, 2010 4:55 pm Post subject: Time by degrees |
|
|
No. I dont need an understanding what the Time by degrees mean.
It is some thing which is helpful in forecasting the timing of the market for a change in trend.
|
|
| Back to top |
|
|
RoyalTrader
White Belt
Joined: 31 Oct 2010
Posts: 75
|
| Post: #10 Posted: Sat Dec 04, 2010 8:48 pm Post subject: |
|
|
Thanks for your clarification nksachdev, and yes you are right timing the market is one of the most important and difficult things for a trader.
Now we go ahead with our analysis..
This time with charts..
Check out attached one...
Regards,
Royal
| Description: |
|
| Filesize: |
49.29 KB |
| Viewed: |
842 Time(s) |
|
|
|
| Back to top |
|
|
nksachdev
White Belt
Joined: 17 Mar 2009
Posts: 11
|
| Post: #11 Posted: Sun Dec 05, 2010 7:47 am Post subject: TIME BY DEGREES |
|
|
| WATCH THE IMPORTANT HIGH OR LOW OF ANY STOCK,COMMODITY,ETC AND GO FORWARD 30,60,90 DAYS ETC AND LOOK FOR CHANGE IN TREND AROUN HE SAME DATE. TO BACK TEST IT IS WORKING GO BACK AND SEE IF THE SAME DATE HAS BEEN WORKING. THEN PREPARE YOURSELF AT THE NEXT DATE TO MAKE A KILLING. FOR SEROIUS TRADER YOU CAN FINE TUNE BY GOING EXACT 30 DEGREES AND WORK OUT EXACT DATE WHEN THE CHANGE IN TREND IS DUE.
|
|
| Back to top |
|
|
RoyalTrader
White Belt
Joined: 31 Oct 2010
Posts: 75
|
| Post: #12 Posted: Sun Dec 05, 2010 9:55 am Post subject: |
|
|
Dear nksachdev,
Thanks for sharing this valuable information.. But this is not the subject matter of this thread, kindly start your own trade based on your observations give some illustrations, examples so that everyone will be benifitted from your knowledge..
And one more thing dont write in capital letters, it looks like somebody is shouting.. Keep it small and simple.. You can write in capital letters but only to highlight some important sentences.. No bad feelings.. Just advising you as a good friend...
All the best...!
Regards,
Royal
|
|
| Back to top |
|
|
nksachdev
White Belt
Joined: 17 Mar 2009
Posts: 11
|
| Post: #13 Posted: Sun Dec 05, 2010 12:43 pm Post subject: Time by degrees |
|
|
I didn't realize about capitals but the idea is to understand.
The best example from recent lot is the low made on 26th Nov. which was exactly 180 degrees from the May 25th low.
I did make purchase based on the above and made some good money out of it. I closed my trade on Friday when Nifty recovered 50 % of the fall .
Next example is that we had top on 4/6 Oct. which was followed by the top on 5th Nov which was time to go short when it broke the low of that day with stop of high of that day.
Each one of us has to spend time and get the confidence of trading the way explained above and not just follow someone else advice.
|
|
| Back to top |
|
|
RoyalTrader
White Belt
Joined: 31 Oct 2010
Posts: 75
|
| Post: #14 Posted: Sun Dec 05, 2010 1:55 pm Post subject: |
|
|
nice observation and explaination.. This is gann way of trading.. In one of his quotes he said that dont rely solely on time by degrees technique, use other techniques like gann square of nine, time price analysis, square of 12 etc. in conjuction with this techniques to obtain optimised reliable results.. i have studied gann very well, but i have never mentioned anywhere in this thread about this, as this is all about price volume analysis along with imp support resistance levels, and this is quite simple and reliable technique.. Gann is a bit complicated for those who are new to the market and not afford to loose much.. They need a trading style which is simple but profitable.. For that purpose i have started this thread, so its better if you start another thread with your valuable knowledge about gann.. But this is certainly not a right place to discuss about gann...
Regards,
Royal
|
|
| Back to top |
|
|
RoyalTrader
White Belt
Joined: 31 Oct 2010
Posts: 75
|
| Post: #15 Posted: Tue Dec 07, 2010 11:00 am Post subject: |
|
|
sorry guys for updating late, actually i am not well. Anyways yesterday market went above the resistance zone of 6020-6050 but could not held that level and fell sharply in the second half of the day.. Volume was missing a bit concern.. it clearlyy indicates that market is not supporting higher prices.. I will advise not to remain long in this markt.. one can think of shorting as per risk tolerance levels. Stop loss for short is above 6030. To initiate long we need closing above 6050
Regards,
Royal
|
|
| Back to top |
|
|
|


