| View previous topic :: View next topic |
| Author |
TECHNICAL--POST COMMENT |
r.dibya
White Belt

Joined: 26 Jun 2008
Posts: 79
|
Post: #1  Posted: Wed Oct 21, 2009 1:49 am Post subject: TECHNICAL--POST COMMENT Posted: Wed Oct 21, 2009 1:49 am Post subject: TECHNICAL--POST COMMENT |
 |
|
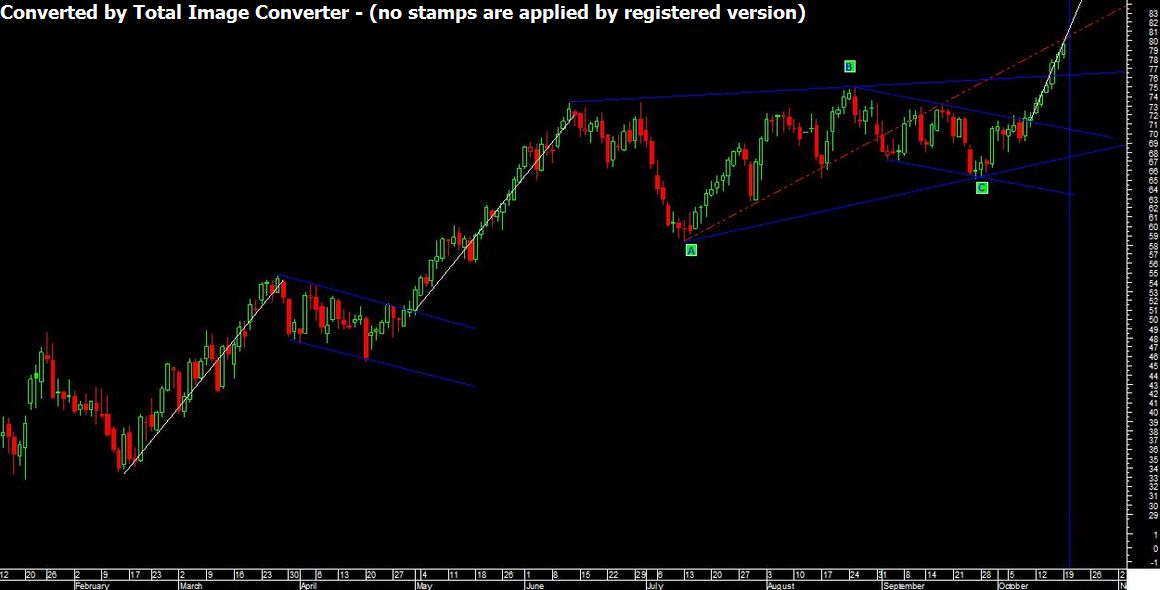
this ic international crude chart , after consolidate or creat new pattern --rally is continue , ithink crude wil touch 86 or 93/100 level
| Description: |
|
| Filesize: |
63.67 KB |
| Viewed: |
4413 Time(s) |
|
|
|
| Back to top |
|
 |
|
|
|
r.dibya
White Belt
Joined: 26 Jun 2008
Posts: 79
|
| Post: #2 Posted: Wed Oct 21, 2009 1:52 am Post subject: |
|
|
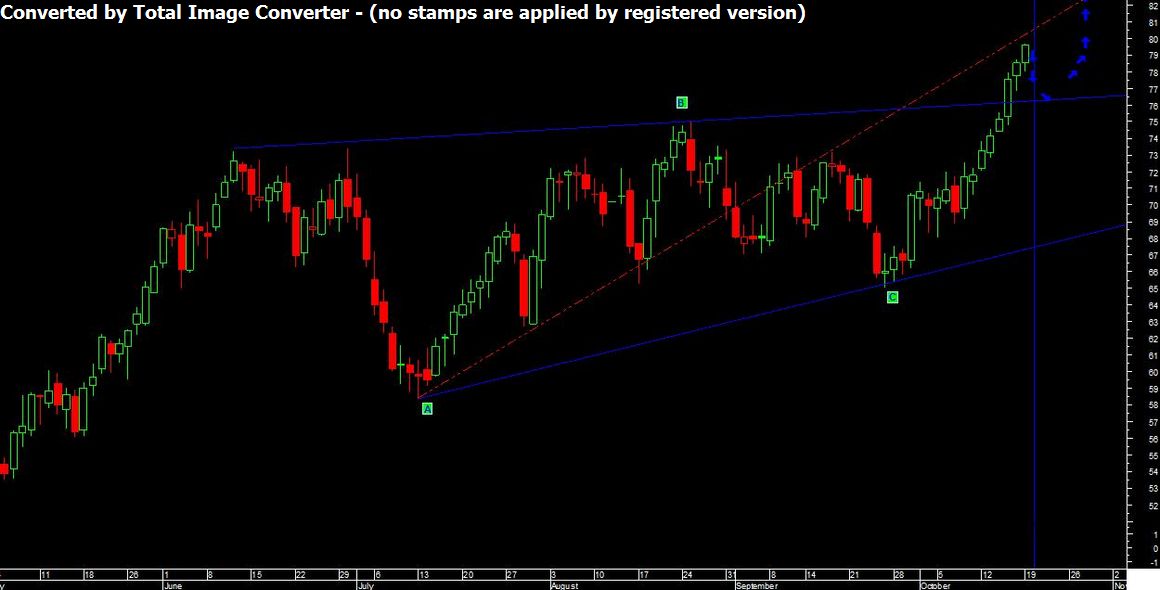
crude will trade in the range of 81 -77 then it will be creat new high
| Description: |
|
| Filesize: |
62.64 KB |
| Viewed: |
4426 Time(s) |
|
|
|
| Back to top |
|
|
r.dibya
White Belt
Joined: 26 Jun 2008
Posts: 79
|
| Post: #3 Posted: Wed Oct 21, 2009 1:54 am Post subject: |
|
|
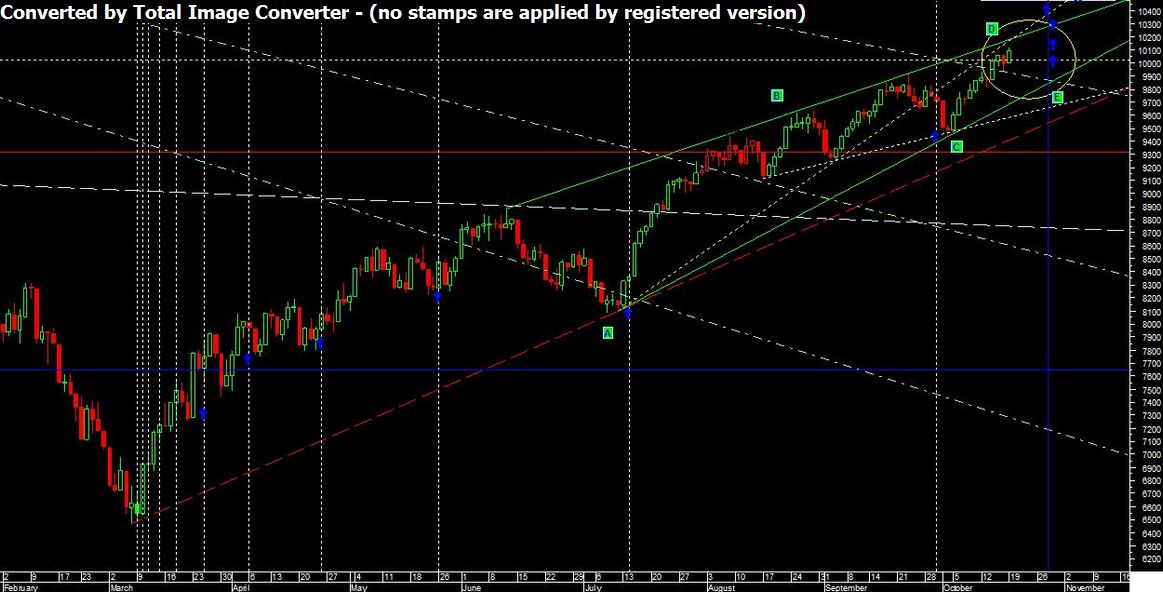
this is DOW chart---- time analysis & ABCDE pattern is there
i think DOW will consolidate 10100-9850 level then it will be touch 10500-11000
| Description: |
|
| Filesize: |
109.92 KB |
| Viewed: |
4426 Time(s) |
|
|
|
| Back to top |
|
|
r.dibya
White Belt
Joined: 26 Jun 2008
Posts: 79
|
| Post: #4 Posted: Wed Oct 21, 2009 1:56 am Post subject: |
|
|
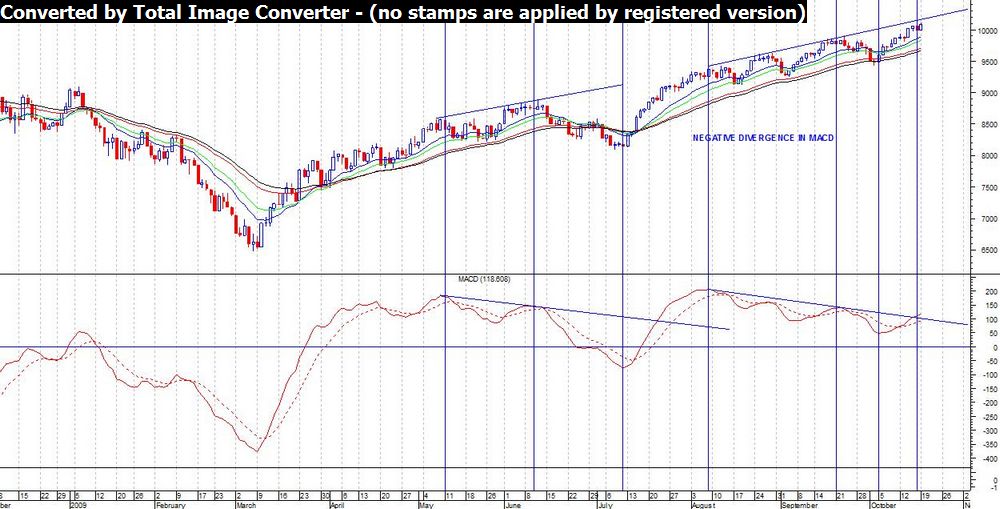
DOW is in negative divergence so be carefull from this level
| Description: |
|
| Filesize: |
105.37 KB |
| Viewed: |
4445 Time(s) |
|
|
|
| Back to top |
|
|
r.dibya
White Belt
Joined: 26 Jun 2008
Posts: 79
|
| Post: #5 Posted: Wed Oct 21, 2009 2:01 am Post subject: |
|
|
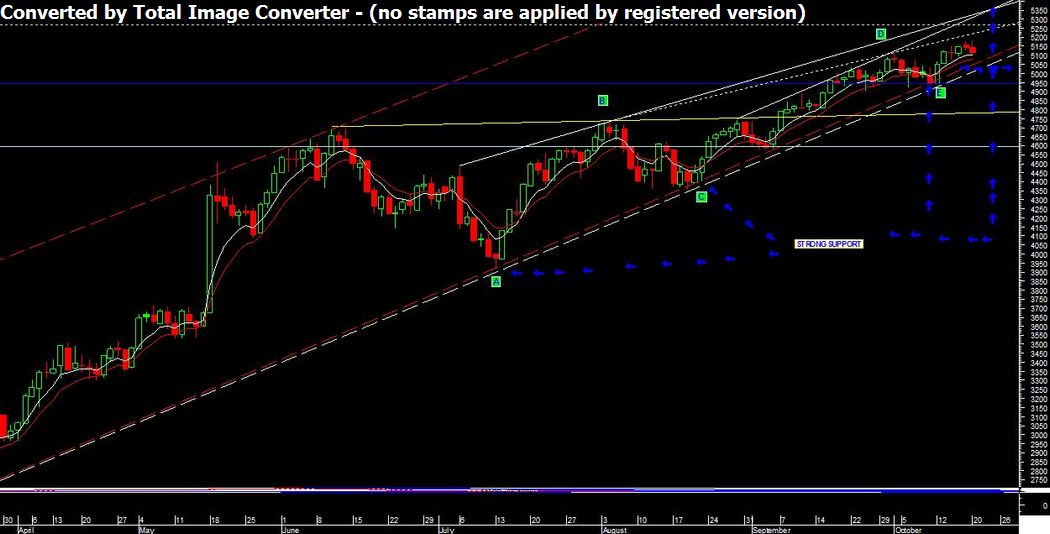
it is NIFTY ABCDE pattern. so i think one more rally is needed. but negative divergence in daily chart.
but nifty may consolidate for somedays in the range of 5080-5150 then it will be touch or creat new high.
but evry BUY position has sl 5040-50 , before i told REALESTED sector in in bullish mode. & min. 10% rally is there & metal sector also.
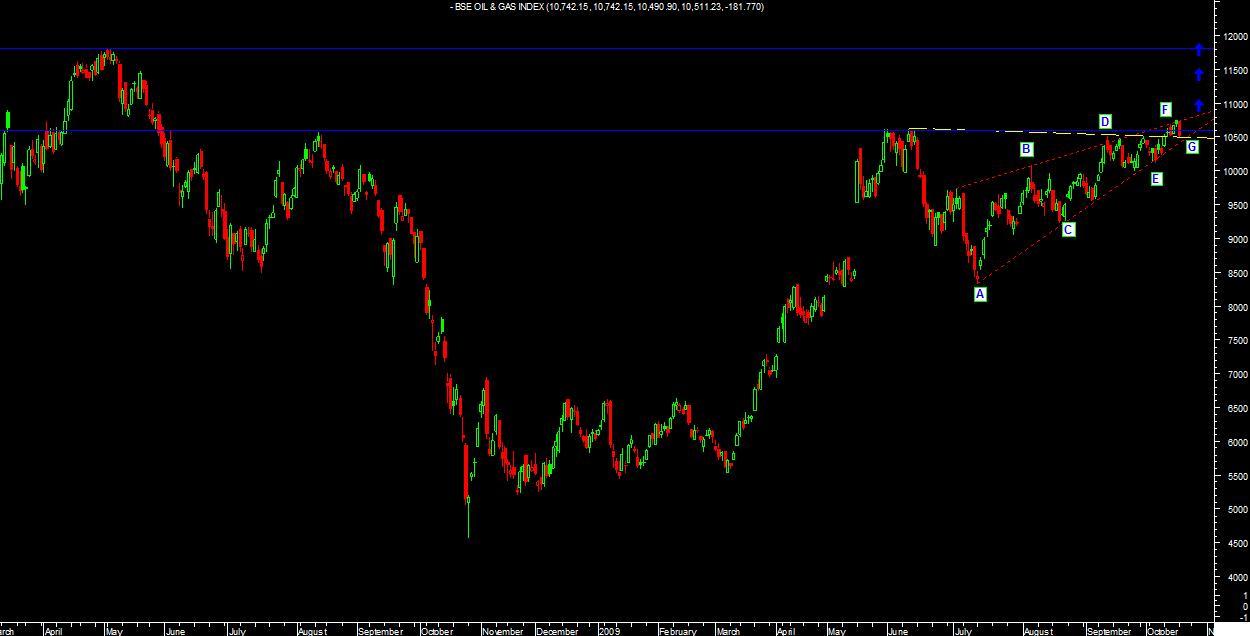
so watch on BSE OIL & GAS sector.
| Description: |
|
| Filesize: |
78.57 KB |
| Viewed: |
4501 Time(s) |
|
|
|
| Back to top |
|
|
r.dibya
White Belt
Joined: 26 Jun 2008
Posts: 79
|
| Post: #6 Posted: Wed Oct 21, 2009 2:04 am Post subject: |
|
|
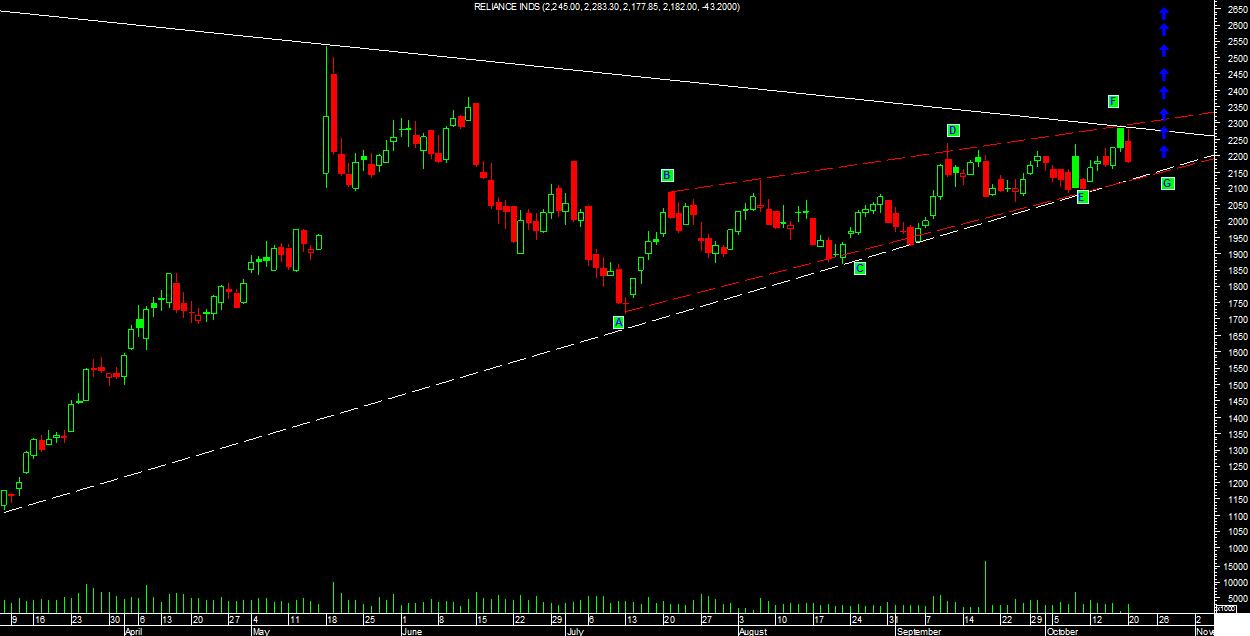
it s reliance ABCDE pattern
| Description: |
|
| Filesize: |
75.53 KB |
| Viewed: |
4500 Time(s) |
|
|
|
| Back to top |
|
|
r.dibya
White Belt
Joined: 26 Jun 2008
Posts: 79
|
| Post: #7 Posted: Wed Oct 21, 2009 2:05 am Post subject: |
|
|
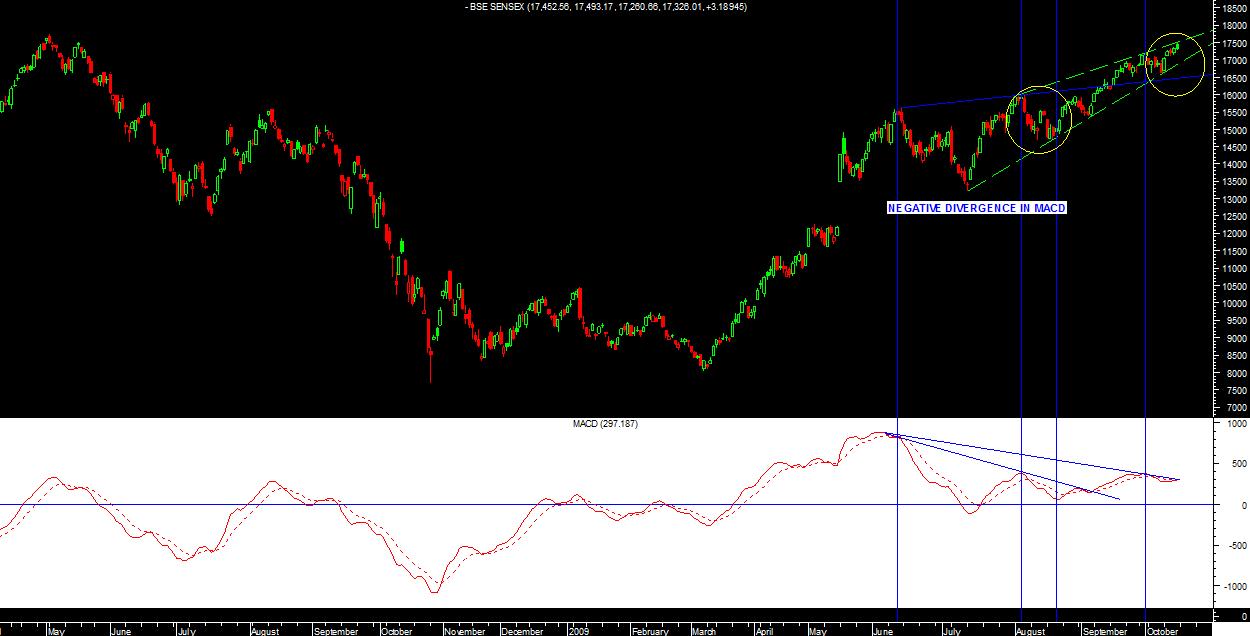
sensex negative divergence in daily chart
| Description: |
|
| Filesize: |
81.2 KB |
| Viewed: |
4499 Time(s) |
|
|
|
| Back to top |
|
|
r.dibya
White Belt
Joined: 26 Jun 2008
Posts: 79
|
| Post: #8 Posted: Wed Oct 21, 2009 2:07 am Post subject: |
|
|
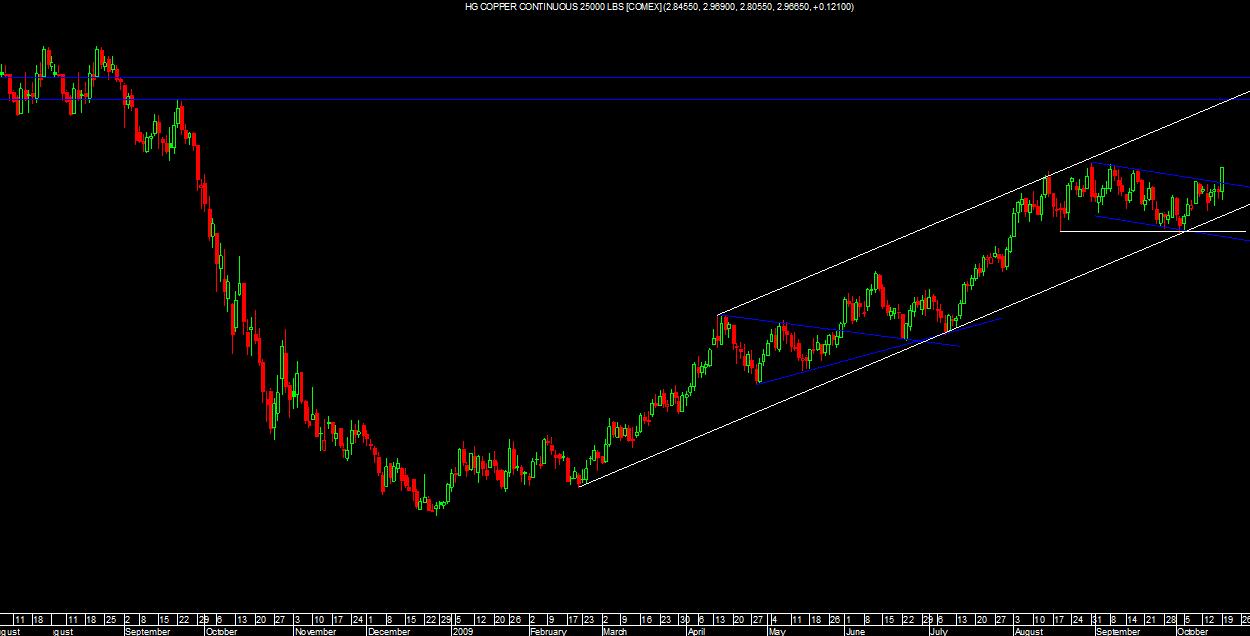
COMEX COPPER IS howing bullish in near fut.
| Description: |
|
| Filesize: |
64.77 KB |
| Viewed: |
4498 Time(s) |
|
|
|
| Back to top |
|
|
r.dibya
White Belt
Joined: 26 Jun 2008
Posts: 79
|
| Post: #9 Posted: Wed Oct 21, 2009 2:08 am Post subject: |
|
|
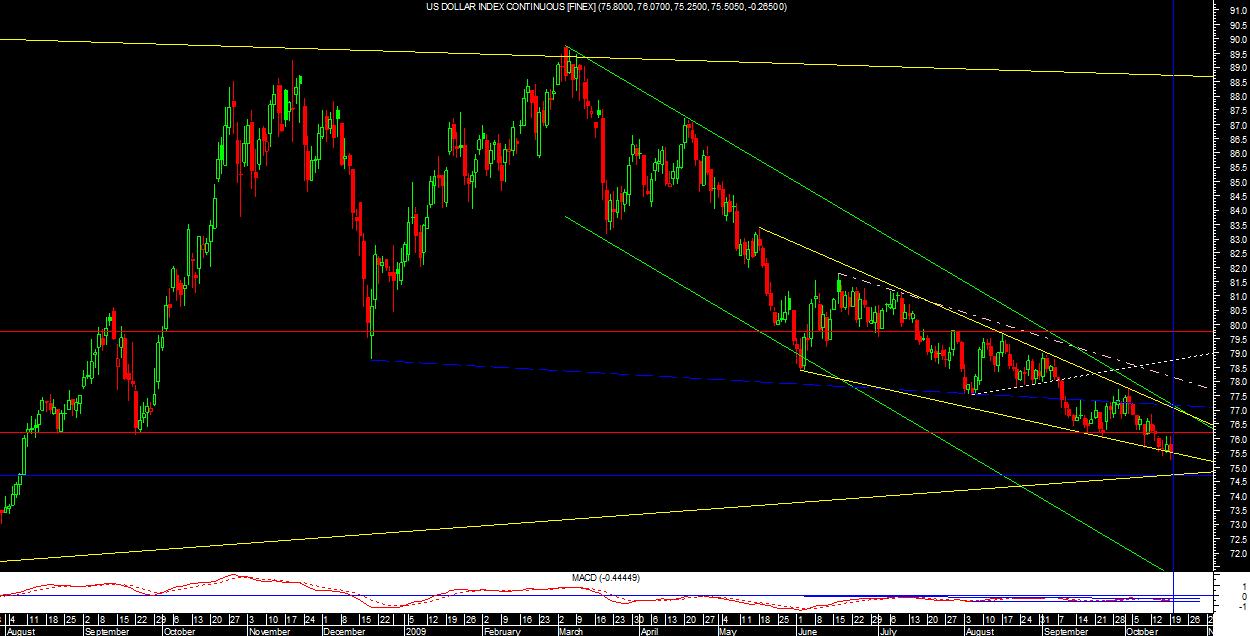
US DOLLAR is not in U TURN
| Description: |
|
| Filesize: |
109.08 KB |
| Viewed: |
4497 Time(s) |
|
|
|
| Back to top |
|
|
r.dibya
White Belt
Joined: 26 Jun 2008
Posts: 79
|
| Post: #10 Posted: Wed Oct 21, 2009 2:12 am Post subject: |
|
|
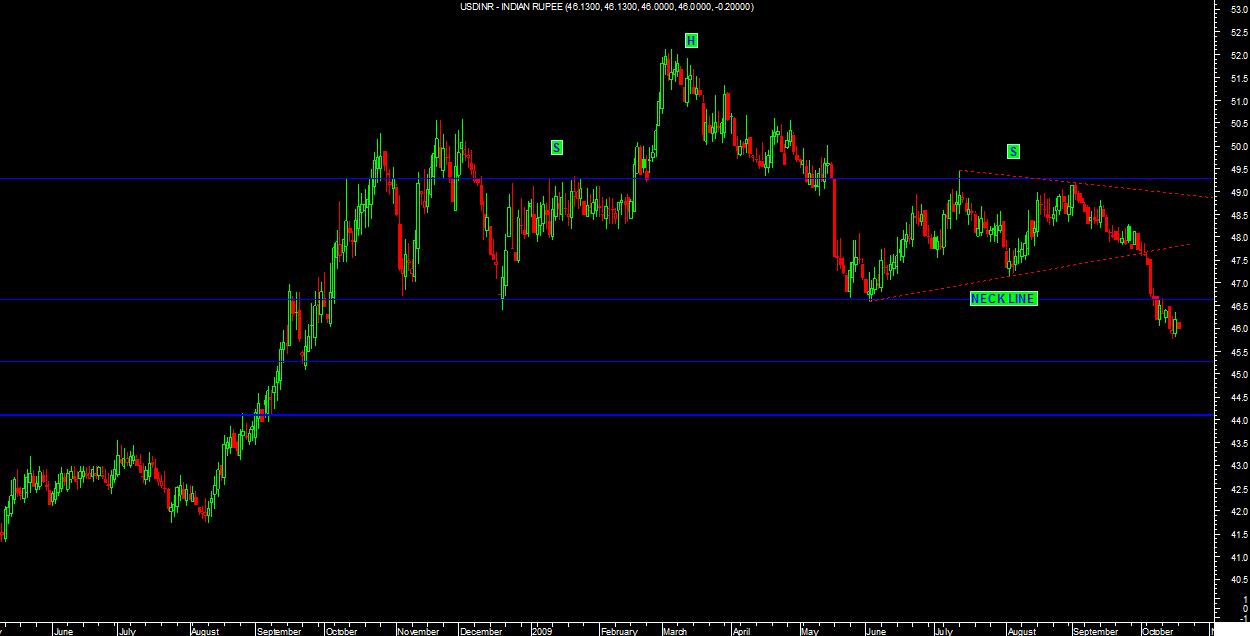
after brokedown the neckline (47) in USD/INR --doesn't show bullish in near fut. due to after sustain below 47 tgt. 45.50/44.20
| Description: |
|
| Filesize: |
71.21 KB |
| Viewed: |
4495 Time(s) |
|
|
|
| Back to top |
|
|
r.dibya
White Belt
Joined: 26 Jun 2008
Posts: 79
|
| Post: #11 Posted: Wed Oct 21, 2009 1:43 pm Post subject: |
|
|
bse oil & gas index ---after breakout above 10600/800 tgt. 11800 near about 10% rally from this level
| Description: |
|
| Filesize: |
64.53 KB |
| Viewed: |
6691 Time(s) |
|
|
|
| Back to top |
|
|
r.dibya
White Belt
Joined: 26 Jun 2008
Posts: 79
|
| Post: #12 Posted: Wed Oct 21, 2009 10:32 pm Post subject: |
|
|
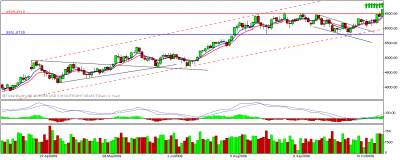
it is LME copper chart. i told u before after breakout in US copper ,it will touch new high 330/340 level. but in LME breakout near 6480 .
but i am more bullish in zinc,alluminium,nickel from this level than cooper.
u will get more return than cooper in MCX.
see onwards Metal sector will be good rally si that will be help ful for equity marke. but this is last rally for metal sector in commodities market.
so i amm more positive in market ----positive in BSE OIL & GAS, REALESTED,METAL SECTOR IN NEAR FUTURE.
| Description: |
|
| Filesize: |
41.26 KB |
| Viewed: |
482 Time(s) |
|
|
|
| Back to top |
|
|
r.dibya
White Belt
Joined: 26 Jun 2008
Posts: 79
|
| Post: #13 Posted: Wed Oct 21, 2009 10:36 pm Post subject: |
|
|
i need ur help that is----
it is helpfull or not for trading with technical chart. if anything is wrong there ,u can rectify it by mail to me.
i need ur comment. because i just want to how many pepole to follow it.
|
|
| Back to top |
|
|
rrang438
White Belt
Joined: 17 Sep 2008
Posts: 40
|
| Post: #14 Posted: Thu Oct 22, 2009 9:48 pm Post subject: Hello dibya |
|
|
Thanks for your reqular update....
I am reading your post for last one year... so do not stop... hopefully others alos will reading really who theywant learn technical....
i like your chart when you say the reason for stocks/index going up or down....
if you give your email address... it will be helpful to communcate with you
|
|
| Back to top |
|
|
|


