| View previous topic :: View next topic |
| Author |
THE MOTHER OF ALL CHARTS |
RAKA
White Belt

Joined: 10 Jun 2007
Posts: 37
|
Post: #1  Posted: Wed Mar 25, 2009 11:01 pm Post subject: THE MOTHER OF ALL CHARTS Posted: Wed Mar 25, 2009 11:01 pm Post subject: THE MOTHER OF ALL CHARTS |
 |
|
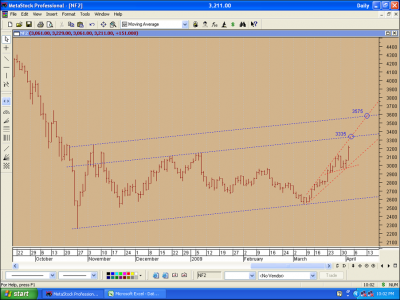
Exit all your long position tomorrow (Thursday). We will see a massive fall in coming days. Tomorrow upside may be capped at 3030. If sustains above 3030 then 3130 is also possible. But this rally is opportunity to sell only.
| Description: |
|
| Filesize: |
208.63 KB |
| Viewed: |
820 Time(s) |
|
|
|
| Back to top |
|
 |
|
| |
RAKA
White Belt
Joined: 10 Jun 2007
Posts: 37
|
| Post: #2 Posted: Sun Mar 29, 2009 11:57 am Post subject: |
|
|
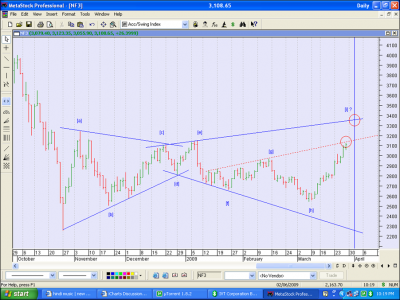
Tgt 3130 almost acheived. But Nifty seems to rally for few more days (Prabably till Wednesday). Tgt may be circled point marked [i] on the chart. It comes around 3355. But dont bet for that tgt. The intermediate fibbonacci tgts for Nifty may be 3165......3240....and 3280.
| Description: |
|
| Filesize: |
226.81 KB |
| Viewed: |
779 Time(s) |
|
|
|
| Back to top |
|
|
jp12
White Belt
Joined: 24 Mar 2009
Posts: 4
|
| Post: #3 Posted: Wed Apr 01, 2009 1:12 pm Post subject: Nifty levels |
|
|
Hi Raka,
Nifty was swinging of late ,do ur 3100+ levels stand valid .
Jp12
|
|
| Back to top |
|
|
RAKA
White Belt
Joined: 10 Jun 2007
Posts: 37
|
| Post: #4 Posted: Thu Apr 02, 2009 9:36 am Post subject: |
|
|
Hi jp12,
Frankly speaking I am also confused now. Suddenly nifty has become super bullish. I dont know what has changed in the world. As of now Nifty seems to clock super gains in the month of April. Just for academic interest watch for 3165....3280....3355....3405....3677.. fibo levels. 
|
|
| Back to top |
|
|
doji
White Belt
Joined: 22 Nov 2006
Posts: 31
|
| Post: #5 Posted: Thu Apr 02, 2009 3:44 pm Post subject: |
|
|
RAKA, Nifty is going through the roof ! 
|
|
| Back to top |
|
|
jp12
White Belt
Joined: 24 Mar 2009
Posts: 4
|
| Post: #6 Posted: Thu Apr 02, 2009 7:03 pm Post subject: Nifty levels |
|
|
Hi raka,
Nifty hit 3200 as per ur Trendlines , However Iam short as of now with an average of 3100,having an eye on uncertain political enviornment . Hope we get that levels again to square off 
Jp12
|
|
| Back to top |
|
|
RAKA
White Belt
Joined: 10 Jun 2007
Posts: 37
|
|
| Back to top |
|
|
|
|
You cannot post new topics in this forum
You cannot reply to topics in this forum
You cannot edit your posts in this forum
You cannot delete your posts in this forum
You cannot vote in polls in this forum
You can attach files in this forum
You can download files in this forum
|
Powered by phpBB © 2001, 2005 phpBB Group
|
|