| View previous topic :: View next topic |
| did u find it useful? |
| yes |
|
70% |
[ 12 ] |
| no |
|
29% |
[ 5 ] |
|
| Total Votes : 17 |
|
| Author |
Trades as per EW.... |
arvindeept
White Belt

Joined: 25 Jun 2012
Posts: 107
|
Post: #1  Posted: Sun Sep 09, 2012 4:50 pm Post subject: Trades as per EW.... Posted: Sun Sep 09, 2012 4:50 pm Post subject: Trades as per EW.... |
 |
|
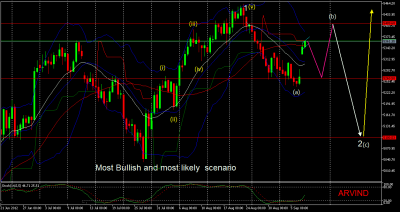
Well I am going to share the trades as per EW analysis......pls feel free to share your views.......as EW setup has multiple possibilities.......
JUST LIKE ANY OTHER TRADING SETUP, IT ALSO HAS ITS PROBABILITIES.
I have implemented it in my trades with quite a bit of success....so sharing here....
AND YES..........ONE IMPORTANT POINT FOR EW ENTHUSIASTS..........
" DONT EVER BANG YOUR HEADS IN A SCRIP WHERE THERE ISN'T A CLEAR EW PATTERN..........BE A HUNTER.........HUNT FOR THE SCRIPS WHERE U HAVE A CLEAR EW PATTERN..........AND U WILL SUCCEED LIKE NEVER BEFORE!!!!!!!!!!"
| Description: |
| These are the maximum up and down targets for the coming few days for nifty....... |
|
| Filesize: |
56.06 KB |
| Viewed: |
612 Time(s) |
|
|
|
| Back to top |
|
 |
|
|
|
MILANCHN
White Belt
Joined: 12 Mar 2009
Posts: 105
|
| Post: #2 Posted: Sun Sep 09, 2012 7:09 pm Post subject: nifty |
|
|
| arvind- is the chart saying-5260-5409-5100 nd then up- i
|
|
| Back to top |
|
|
arvindeept
White Belt
Joined: 25 Jun 2012
Posts: 107
|
| Post: #3 Posted: Sun Sep 09, 2012 8:44 pm Post subject: Re: nifty |
|
|
| MILANCHN wrote: | | arvind- is the chart saying-5260-5409-5100 nd then up- i |
yes milan.....as per my interpretation of the chart......it seems so.....ITS ONE OF THE MANY POSSIBILITIES.....
|
|
| Back to top |
|
|
drsureshbs
White Belt
Joined: 22 Oct 2008
Posts: 58
|
| Post: #4 Posted: Mon Sep 10, 2012 12:03 am Post subject: |
|
|
| ARVID good initiative a basic introduction to e w would be good to grasp ur analysis
|
|
| Back to top |
|
|
arvindeept
White Belt
Joined: 25 Jun 2012
Posts: 107
|
| Post: #5 Posted: Mon Sep 10, 2012 12:11 am Post subject: |
|
|
| drsureshbs wrote: | | ARVID good initiative a basic introduction to e w would be good to grasp ur analysis |
Thnx dr suresh.....let us see how many can benefit.....my analysis is there for u all on my chart here.....
However yes....in case you all would like to have supporting material on EW......pls google it.......or let me know if u want it from me.......I'll be more than happy to share....
|
|
| Back to top |
|
|
nifty7
White Belt
Joined: 04 Oct 2009
Posts: 6
|
| Post: #6 Posted: Mon Sep 10, 2012 2:24 am Post subject: |
|
|
| arvindeept: can you please give a smal explaination abt the theory or the idea you have mentioned. what is ew? and based on that how come the levels you mentioned would be achieved and what is the probability?? if you explain i charts users will have some better understanding abt your concept. Thanks
|
|
| Back to top |
|
|
arvindeept
White Belt
Joined: 25 Jun 2012
Posts: 107
|
| Post: #7 Posted: Mon Sep 10, 2012 7:38 am Post subject: |
|
|
| nifty7 wrote: | | arvindeept: can you please give a smal explaination abt the theory or the idea you have mentioned. what is ew? and based on that how come the levels you mentioned would be achieved and what is the probability?? if you explain i charts users will have some better understanding abt your concept. Thanks |
Dear bro,
Elliot Wave Theory is supposed to be the most original and logical interpretation of market.........and it gives us the technical analysis of the market based on the market sentiments during various phases....
As I said above , its nothing new.......very good but very difficult to master........so me also just a student.....will remain always....
You can google n number of pdf's to learn.....but if u want it from me pls let me know.....though i dont know whether its against the policy here....
|
|
| Back to top |
|
|
arvindeept
White Belt
Joined: 25 Jun 2012
Posts: 107
|
| Post: #8 Posted: Mon Sep 10, 2012 9:38 am Post subject: |
|
|
Few scrips for the coming week......
1. Ranbaxy.....SELL ONLY BELOW 541 sl 545 tgt 530....515.
2. Guj Ambuja........Buy on dips near 185....sl 180......tgt 193....196.
3. Reliance.......SELL only below 793 sl 796.....tgt 788......783.
|
|
| Back to top |
|
|
ridinghood
Yellow Belt

Joined: 16 Apr 2009
Posts: 724
|
| Post: #9 Posted: Mon Sep 10, 2012 12:27 pm Post subject: |
|
|
| Quote: | Few scrips for the coming week......
1. Ranbaxy.....SELL ONLY BELOW 541 sl 545 tgt 530....515.
2. Guj Ambuja........Buy on dips near 185....sl 180......tgt 193....196.
3. Reliance.......SELL only below 793 sl 796.....tgt 788......783. |
hi arvin,
pl see if can spot ew pattern on hul,itc nd guide about levels.
regs
ridinghood
|
|
| Back to top |
|
|
vishyvaranasi
Green Belt

Joined: 11 Jul 2011
Posts: 1159
|
| Post: #10 Posted: Mon Sep 10, 2012 12:29 pm Post subject: |
|
|
The rates are future or cash
Vishy
| ridinghood wrote: | | Quote: | Few scrips for the coming week......
1. Ranbaxy.....SELL ONLY BELOW 541 sl 545 tgt 530....515.
2. Guj Ambuja........Buy on dips near 185....sl 180......tgt 193....196.
3. Reliance.......SELL only below 793 sl 796.....tgt 788......783. |
hi arvin,
pl see if can spot ew pattern on hul,itc nd guide about levels.
regs
ridinghood |
|
|
| Back to top |
|
|
sherbaaz
Yellow Belt
Joined: 27 May 2009
Posts: 543
|
| Post: #11 Posted: Mon Sep 10, 2012 12:46 pm Post subject: |
|
|
| arvindeept wrote: | Few scrips for the coming week......
1. Ranbaxy.....SELL ONLY BELOW 541 sl 545 tgt 530....515.
2. Guj Ambuja........Buy on dips near 185....sl 180......tgt 193....196.
3. Reliance.......SELL only below 793 sl 796.....tgt 788......783. |
reliance is not a SELL as per ew its in W.5 on eod chart started around 760.
regds,
|
|
| Back to top |
|
|
arvindeept
White Belt
Joined: 25 Jun 2012
Posts: 107
|
| Post: #12 Posted: Mon Sep 10, 2012 1:39 pm Post subject: |
|
|
| sherbaaz wrote: | | arvindeept wrote: | Few scrips for the coming week......
1. Ranbaxy.....SELL ONLY BELOW 541 sl 545 tgt 530....515.
2. Guj Ambuja........Buy on dips near 185....sl 180......tgt 193....196.
3. Reliance.......SELL only below 793 sl 796.....tgt 788......783. |
reliance is not a SELL as per ew its in W.5 on eod chart started around 760.
regds, |
reliance cmp 792
ranbaxy and gujamb not yet activated.....
|
|
| Back to top |
|
|
arvindeept
White Belt
Joined: 25 Jun 2012
Posts: 107
|
| Post: #13 Posted: Mon Sep 10, 2012 1:44 pm Post subject: |
|
|
| Buy nifty at 5360-61 sl 5355 tgt 5370 5375...
|
|
| Back to top |
|
|
arvindeept
White Belt
Joined: 25 Jun 2012
Posts: 107
|
| Post: #14 Posted: Mon Sep 10, 2012 1:51 pm Post subject: |
|
|
| ridinghood wrote: | | Quote: | Few scrips for the coming week......
1. Ranbaxy.....SELL ONLY BELOW 541 sl 545 tgt 530....515.
2. Guj Ambuja........Buy on dips near 185....sl 180......tgt 193....196.
3. Reliance.......SELL only below 793 sl 796.....tgt 788......783. |
hi arvin,
pl see if can spot ew pattern on hul,itc nd guide about levels.
regs
ridinghood |
will surely tell u in evening bhai....bit busy rite now....
|
|
| Back to top |
|
|
arvindeept
White Belt
Joined: 25 Jun 2012
Posts: 107
|
| Post: #15 Posted: Mon Sep 10, 2012 1:54 pm Post subject: |
|
|
| arvindeept wrote: | | Buy nifty at 5360-61 sl 5355 tgt 5370 5375... |
modify sl 5363
|
|
| Back to top |
|
|
|


