| View previous topic :: View next topic |
| Author |
Trading - Al Brooks's way |
gauravminku
White Belt

Joined: 06 Jul 2011
Posts: 4
|
Post: #1  Posted: Wed May 08, 2013 7:14 pm Post subject: Trading - Al Brooks's way Posted: Wed May 08, 2013 7:14 pm Post subject: Trading - Al Brooks's way |
 |
|
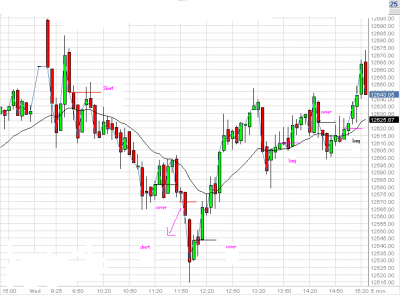
learning al brooks,
setup 5 min candlestick with 20 ema.
1st entry is on first pullback.
2nd entry after doji (2nd low from ema).
3rd & 4th entry, near ema.
Comments are welcome
| Description: |
|
| Filesize: |
32.11 KB |
| Viewed: |
878 Time(s) |

|
|
|
| Back to top |
|
 |
|
|  |
mogili
Green Belt

Joined: 29 Jan 2013
Posts: 1025
|
Post: #2  Posted: Wed May 08, 2013 8:42 pm Post subject: Re: Trading - Al Brooks's way Posted: Wed May 08, 2013 8:42 pm Post subject: Re: Trading - Al Brooks's way |
 |
|
| gauravminku wrote: | learning al brooks,
setup 5 min candlestick with 20 ema.
1st entry is on first pullback.
2nd entry after doji (2nd low from ema).
3rd & 4th entry, near ema.
Comments are welcome |
I am hearing Al Brooks Way strategy for the first time. There will be many who would like to know more about this strategy.
A brief introduction of the strategy will be highly appreciated.
Thanks for your understanding.
|
|
| Back to top |
|
 |
gauravminku
White Belt

Joined: 06 Jul 2011
Posts: 4
|
Post: #3  Posted: Wed May 08, 2013 8:59 pm Post subject: Posted: Wed May 08, 2013 8:59 pm Post subject: |
 |
|
Actually, it's not a strategy. Al Brooks is a price action trader, author of books. I am going through his books (in learning stage). He is basically trying to teach us how to read price action. The books are full of techniques/setups. One can use the techniques according to one's own comfort level. He uses 5 min chart with 20 ema, as I have used in the attachment.
I have tested it with banknifty. It goes very well. Other stocks are Relinfra, Tata Steel. I have tried it with crude also by tweaking it, goes very well that also.
Will post more charts as and when I get the time.
Ok. I try to explain.
First entry is the pullback entry. Market opened, went down then we had a pullback(known as first pullback). Short below the red bar with filter (for bank nifty, 5 points filter).
Second entry is again pullback to ema then we got a lower low. Short below the candle which is doji in this case again with filter.
Third and fourth entry are also pullback to ema.
In early stages, when there is a trend, easy and profitable setups are pullback to ema and rejection(buy/sell near ema).
Thanks,
Gaurav
|
|
| Back to top |
|
 |
taruj
White Belt

Joined: 20 Apr 2011
Posts: 260
|
Post: #4  Posted: Wed Jul 03, 2013 3:11 pm Post subject: Posted: Wed Jul 03, 2013 3:11 pm Post subject: |
 |
|
| gauravminku wrote: | Actually, it's not a strategy. Al Brooks is a price action trader, author of books. I am going through his books (in learning stage). He is basically trying to teach us how to read price action. The books are full of techniques/setups. One can use the techniques according to one's own comfort level. He uses 5 min chart with 20 ema, as I have used in the attachment.
I have tested it with banknifty. It goes very well. Other stocks are Relinfra, Tata Steel. I have tried it with crude also by tweaking it, goes very well that also.
Will post more charts as and when I get the time.
Ok. I try to explain.
First entry is the pullback entry. Market opened, went down then we had a pullback(known as first pullback). Short below the red bar with filter (for bank nifty, 5 points filter).
Second entry is again pullback to ema then we got a lower low. Short below the candle which is doji in this case again with filter.
Third and fourth entry are also pullback to ema.
In early stages, when there is a trend, easy and profitable setups are pullback to ema and rejection(buy/sell near ema).
Thanks,
Gaurav |
Can pullback be quantified?
regards,
|
|
| Back to top |
|
 |
|
|
You cannot post new topics in this forum
You cannot reply to topics in this forum
You cannot edit your posts in this forum
You cannot delete your posts in this forum
You cannot vote in polls in this forum
You can attach files in this forum
You can download files in this forum
|
Powered by phpBB © 2001, 2005 phpBB Group
|
|

