| View previous topic :: View next topic |
| Author |
Trading based on "TREND DEVIATION" indicator |
ashutoshbpl
White Belt

Joined: 19 Jan 2009
Posts: 25
|
Post: #16  Posted: Sat May 09, 2009 4:33 pm Post subject: Re TRD Posted: Sat May 09, 2009 4:33 pm Post subject: Re TRD |
 |
|
Hi,
First of all let me clear that MACD oscillator and TRD are not the same. Taking the same example of HDFC see candles 16/2 to 18/2 u can see clearly who is the real winner.
thnx a ton to TM coz testing every indicator is not possible for anybody but yes this indicator if studied minutely can give u wonders. Again see TRD on eod of HDFC it is continuously making lower highs a sort of divergence so clearly indicating that this stock should be shorted at highs. my say is do multi time frame analysis using this indicator and confirm ur trade as it definitely gives more confidence while trading.
thnx a lot TM.....
|
|
| Back to top |
|
 |
|
|
 |
vinst
Black Belt

Joined: 09 Jan 2007
Posts: 3303
|
Post: #17  Posted: Sun May 10, 2009 8:59 pm Post subject: Posted: Sun May 10, 2009 8:59 pm Post subject: |
 |
|
Hi,
I found the following on trend deviation. Is this what ashutosh followed?
..............
Trend Deviation and Moving Average (MA)
An alternative approach with trend-deviation indicators is to smooth out unwanted volatility with the aid of two Moving Average (MAs).
An alternative approach with trend-deviation indicators is to smooth out unwanted volatility with the aid of two Moving Average (MAs). The actual trend-deviation series is calculated by taking a 26-week Moving Average (MA) of the closing price divided by a 52-week Moving Average (MA). The second series is simply a 10-week Moving Average (MA) of the first. Buy and sell alerts are then triggered as the smoothed trend deviation indicator crosses above or below its 100week Moving Average (MA). Then look for a confirmation from the price itself.
A useful method that greatly reduces such whipsaw activity, but still offers timely signals, is to advance the 52-week Moving Average (MA) by 10 weeks when the trend-deviation calculation is being made. This means that each weekly close is divided by the 52-week Moving Average (MA) as it appeared 10 weeks before.
In this example, the whipsaw was filtered out since the trend deviation indicator fails to cross decisively below its Moving Average (MA). This is the only legitimate combination for weekly charts, but it is one that appears to operate quite well. There is always a trade-off when you try to make signals less sensitive and in this case we find that there is occasionally a small delay compared to the non advanced 52-week Moving Average (MA).
The most obvious one on this chart developed at the beginning of 1997, where the lagged series in the center panel crossed its Moving Average (MA) at a slightly higher price. In most instances though, this is a small price to pay if a costly whipsaw can be avoided.
.......................
http://www.1technicalanalysis.com/momentum-indicators/MACD/trend-deviation-and-moving-average.php
regards,
vin
|
|
| Back to top |
|
 |
Trade Master
White Belt

Joined: 27 Apr 2009
Posts: 44
|
Post: #18  Posted: Mon May 11, 2009 11:08 pm Post subject: Posted: Mon May 11, 2009 11:08 pm Post subject: |
 |
|
Would like to thank ashu and vinst for throwing lite on the topic. Well, trades based on trend deviation are working fine with me, be it HDFC shorts of last day,or nifty charts with 10,30,60 minute TF's....rarely it has given any wrong trade indications. Would come soon with more charts on this...trade well till then ! 
|
|
| Back to top |
|
 |
rvg
White Belt

Joined: 31 Oct 2006
Posts: 279
|
Post: #19  Posted: Wed May 13, 2009 3:41 pm Post subject: MACDO+TRD Posted: Wed May 13, 2009 3:41 pm Post subject: MACDO+TRD |
 |
|
I believe MACDO can give confirmation signal on TRD.. please give feedback on attached chart of Nifty Spot
| Description: |
|
| Filesize: |
47.52 KB |
| Viewed: |
840 Time(s) |

|
|
|
| Back to top |
|
 |
ashutoshbpl
White Belt

Joined: 19 Jan 2009
Posts: 25
|
Post: #20  Posted: Thu May 14, 2009 4:05 pm Post subject: Posted: Thu May 14, 2009 4:05 pm Post subject: |
 |
|
| rv macdo just lags trd, yes it can be best used as a combo. So best things is to enter positions on trd and use macdo as confirmations.
|
|
| Back to top |
|
 |
Trade Master
White Belt

Joined: 27 Apr 2009
Posts: 44
|
Post: #21  Posted: Fri May 15, 2009 5:23 pm Post subject: Posted: Fri May 15, 2009 5:23 pm Post subject: |
 |
|
Hi Folks
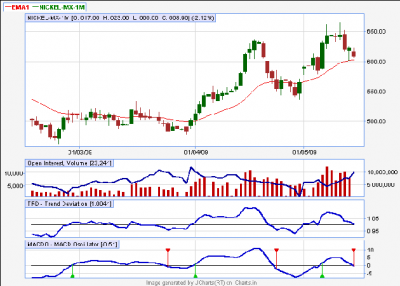
Posting Nickle May-09 chart ..based on EOD projections of TRD, its time now to cross below 1 level now...it may take a bit of whipsaws, but as per MACDO confirmation also (considering point of RVGANDHI), downtrend is visible..I am now short on it @ 610 and will keep it till expiry with SL of 625-630, and SL is reversible.
Thanks
TM
| Description: |
|
| Filesize: |
12.56 KB |
| Viewed: |
676 Time(s) |

|
|
|
| Back to top |
|
 |
Trade Master
White Belt

Joined: 27 Apr 2009
Posts: 44
|
Post: #22  Posted: Tue May 19, 2009 11:27 am Post subject: Posted: Tue May 19, 2009 11:27 am Post subject: |
 |
|
Hi guys
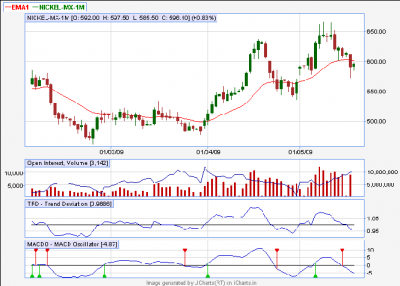
So Nickel short @ 610 as per TRD + MACDO combination confirmation went to 572 levels in 2 trading days only !!!!
Just see the power of TRD guys...
Thanx
TM
| Description: |
|
| Filesize: |
14.03 KB |
| Viewed: |
626 Time(s) |

|
|
|
| Back to top |
|
 |
Trade Master
White Belt

Joined: 27 Apr 2009
Posts: 44
|
Post: #23  Posted: Tue May 19, 2009 5:53 pm Post subject: Posted: Tue May 19, 2009 5:53 pm Post subject: |
 |
|
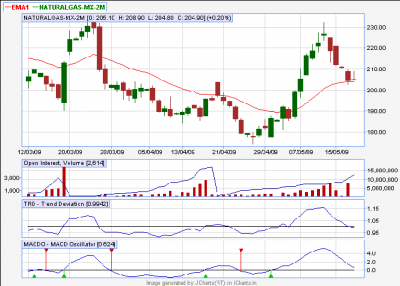
Next target..Natural Gas shorting @ 205-206 levels (June series) with SL 210, and as ever, SL is reversible.
| Description: |
|
| Filesize: |
15.83 KB |
| Viewed: |
672 Time(s) |

|
|
|
| Back to top |
|
 |
Trade Master
White Belt

Joined: 27 Apr 2009
Posts: 44
|
|
| Back to top |
|
 |
HARISRIB
White Belt

Joined: 22 Feb 2009
Posts: 10
|
Post: #25  Posted: Wed May 20, 2009 11:32 pm Post subject: -ve divergence in infosys Posted: Wed May 20, 2009 11:32 pm Post subject: -ve divergence in infosys |
 |
|
Hi Friends,
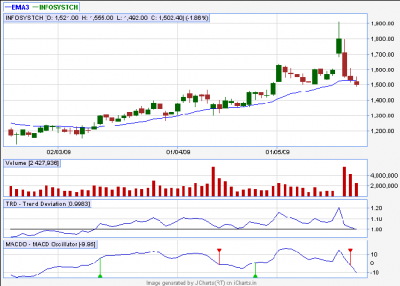
I have been following this system for quite some time now.. Today infosys gave -ve divergence on EOD charts.. Can any guru here confirm the same..
chandu
|
|
| Back to top |
|
 |
Trade Master
White Belt

Joined: 27 Apr 2009
Posts: 44
|
Post: #26  Posted: Thu May 21, 2009 9:29 pm Post subject: Re: -ve divergence in infosys Posted: Thu May 21, 2009 9:29 pm Post subject: Re: -ve divergence in infosys |
 |
|
| HARISRIB wrote: | Hi Friends,
I have been following this system for quite some time now.. Today infosys gave -ve divergence on EOD charts.. Can any guru here confirm the same..
chandu |
Hi Chandu
As you mentioned, -ve divergence is clearly seen in today's EOD Chart of Infosys. Infact, TRD has gone convincingly below 1 level after 11.11.2008 for the first time !!! MACDO is also already in -ve divergence..A bit of support can be seen at 1500 levels but clearly the downmove is expected from here one...
Thanx
TM
| Description: |
|
| Filesize: |
12.06 KB |
| Viewed: |
644 Time(s) |

|
|
|
| Back to top |
|
 |
Trade Master
White Belt

Joined: 27 Apr 2009
Posts: 44
|
|
| Back to top |
|
 |
HARISRIB
White Belt

Joined: 22 Feb 2009
Posts: 10
|
Post: #28  Posted: Fri May 22, 2009 9:39 am Post subject: Thanks for confirmation Posted: Fri May 22, 2009 9:39 am Post subject: Thanks for confirmation |
 |
|
Hi Trade Master,
Thanks for the confirmation.. I am short in infy@1526.. With TRD indicator the entry points for longs or shorts are good.. But which indicator do u use to exit..
Thanks,
Chandu
|
|
| Back to top |
|
 |
karthe
White Belt

Joined: 22 May 2009
Posts: 1
|
Post: #29  Posted: Fri May 22, 2009 1:50 pm Post subject: Posted: Fri May 22, 2009 1:50 pm Post subject: |
 |
|
Hi Trade Master,
Could you please tell me how would you calculate the Stop loss for this?
Thank you.
|
|
| Back to top |
|
 |
ganesh_pl
White Belt

Joined: 15 Aug 2008
Posts: 34
|
Post: #30  Posted: Sun May 24, 2009 10:37 pm Post subject: Trend Deviation Posted: Sun May 24, 2009 10:37 pm Post subject: Trend Deviation |
 |
|
Hi Trade Master,
For Intraday trading what time frame best suited for TRD.. Its good to most reliable signal in EOD chart, Thanks ...
Ganesh.
|
|
| Back to top |
|
 |
|

