| View previous topic :: View next topic |
| Author |
Trading based on "TREND DEVIATION" indicator |
Trade Master
White Belt

Joined: 27 Apr 2009
Posts: 44
|
Post: #31  Posted: Mon May 25, 2009 12:45 pm Post subject: Re: Trend Deviation Posted: Mon May 25, 2009 12:45 pm Post subject: Re: Trend Deviation |
 |
|
| ganesh_pl wrote: |
Hi Trade Master,
For Intraday trading what time frame best suited for TRD.. Its good to most reliable signal in EOD chart, Thanks ...
Ganesh. |
Hi Ganesh
Intraday I would say 10 Min is fine, for swings I use 30, 60 minutes + EOD charts...For any timeframe u pick, take a confirmation from a larger time frame also..eg if u are trading based on 10 Min, take direction from 30 m or 60 m chart also. Dont take SL on your position immediately, because TRD @ 1 levels may take a bit of slow whipsaws. Let the candle close for ur SL's.
Thanx
TM
|
|
| Back to top |
|
 |
|
|
 |
Trade Master
White Belt

Joined: 27 Apr 2009
Posts: 44
|
Post: #32  Posted: Mon May 25, 2009 12:50 pm Post subject: Posted: Mon May 25, 2009 12:50 pm Post subject: |
 |
|
| karthe wrote: | Hi Trade Master,
Could you please tell me how would you calculate the Stop loss for this?
Thank you. |
Hi karthe
SL as i told in previous reply, Let the candle close 1st and let the trend take a breather if TRD howers around 1 level only for 1-2 next candles...If next 1-2 candle is letting TRD opposite to your trade, u can place SL.... if using MACDO with TRD, if MACDO doesnt confirm the trend after TRD confirms, U can exit the trade.
Thanx
TM
|
|
| Back to top |
|
 |
Trade Master
White Belt

Joined: 27 Apr 2009
Posts: 44
|
Post: #33  Posted: Mon May 25, 2009 9:01 pm Post subject: TRD and MACDO Posted: Mon May 25, 2009 9:01 pm Post subject: TRD and MACDO |
 |
|
Hi All
If using TRD alongwith MACDO, while entering trade based on any TF, pls make sure that TRD touch the 1 level TOGETHER or BEFORE the MACDO touch 0 levels...
If MACDO is touching 0 level before TRD, it usually gives false breakout signal !!!
(Pls paper check this if any doubts) 
Thanx
TM
|
|
| Back to top |
|
 |
Trade Master
White Belt

Joined: 27 Apr 2009
Posts: 44
|
Post: #34  Posted: Tue May 26, 2009 10:54 pm Post subject: Posted: Tue May 26, 2009 10:54 pm Post subject: |
 |
|
Hi guys
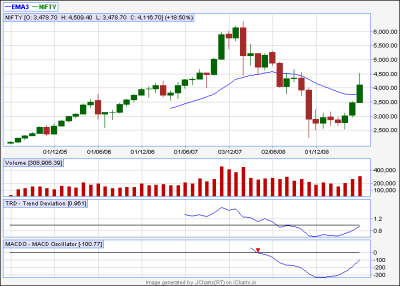
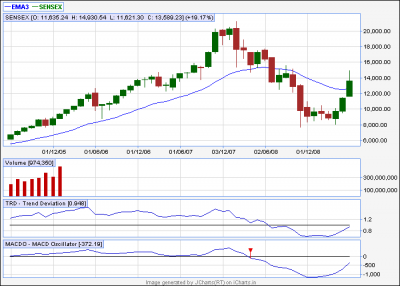
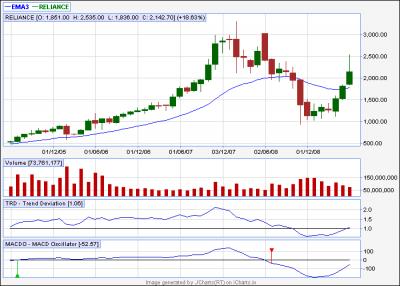
posting Monthly charts of Nifty, Sensex, Reliance only for INVESTORS!!  
Followers of TRD can guess out where we are heading towards 
Thanx
TM
| Description: |
|
| Filesize: |
13.32 KB |
| Viewed: |
658 Time(s) |

|
| Description: |
|
| Filesize: |
13.77 KB |
| Viewed: |
591 Time(s) |

|
| Description: |
|
| Filesize: |
13.65 KB |
| Viewed: |
584 Time(s) |

|
|
|
| Back to top |
|
 |
SKSINGHAL1231
White Belt

Joined: 07 May 2009
Posts: 2
|
Post: #35  Posted: Wed May 27, 2009 9:26 pm Post subject: trading range Posted: Wed May 27, 2009 9:26 pm Post subject: trading range |
 |
|
Hi Trade Master,
I am mostly get caught in the trading range ie. horizontal band.What should I do to overcome this problem.
Thank you.
S K Singhal
|
|
| Back to top |
|
 |
Trade Master
White Belt

Joined: 27 Apr 2009
Posts: 44
|
Post: #36  Posted: Thu May 28, 2009 10:33 am Post subject: Re: trading range Posted: Thu May 28, 2009 10:33 am Post subject: Re: trading range |
 |
|
| SKSINGHAL1231 wrote: | Hi Trade Master,
I am mostly get caught in the trading range ie. horizontal band.What should I do to overcome this problem.
Thank you.
S K Singhal |
Hello Sir
I would request you to post some charts indicating your trades so that I can confirm where u went wrong.
Thanx
TM
|
|
| Back to top |
|
 |
Trade Master
White Belt

Joined: 27 Apr 2009
Posts: 44
|
|
| Back to top |
|
 |
Trade Master
White Belt

Joined: 27 Apr 2009
Posts: 44
|
Post: #38  Posted: Fri May 29, 2009 3:49 pm Post subject: Posted: Fri May 29, 2009 3:49 pm Post subject: |
 |
|
| Trade Master wrote: | Hi friends
posting another chart today .. Natural Gas EOD chart... based on TRD and MACDO, a close around 185-186 today is leading to crossover of TRD 1 level, and MACDO following it smartly 
Also, 22 EMA alongwith it makes me to go LONG in it @ 185 (even after 7% spur today only !!) ...Will follow this trade tomorrow here...
Thanx
TM |
Just an update ... Natural Gas @ 191 at 3:45 today...Up 6 Rs per lot till now !! 
|
|
| Back to top |
|
 |
Trade Master
White Belt

Joined: 27 Apr 2009
Posts: 44
|
|
| Back to top |
|
 |
Trade Master
White Belt

Joined: 27 Apr 2009
Posts: 44
|
|
| Back to top |
|
 |
knrajan31
White Belt

Joined: 01 Apr 2009
Posts: 18
|
Post: #41  Posted: Fri Jun 05, 2009 5:27 am Post subject: intraday trade on trd\ macdo. Posted: Fri Jun 05, 2009 5:27 am Post subject: intraday trade on trd\ macdo. |
 |
|
dear master i have read yr trading mrthod based on trd\macdo .referred ispat ind chart.which i am holdingat rs 25.75.
for day trade u have suggested 10mt tf based on 30\60 tfs.for direction of trend
the following are the readings on the end of trade on 4-6-09
t\f trd macdo
10 1.006 0.0041
30 1.01288 -0.05761 macdo showing after
completion of 3 1\2
hrs trade trade
till then it is 0
60 1.020 0 no reading for whole
day.
trd setting 15 macdo 12 26 9
pl let me know as to why o reading in macdo i 60 mtn t\f & in 30 mts t\f the macdo reading data is showing only after 1.30 pm . for tading in 10 mts t\f do you need to change settings in trd \ macdo .pl reply as i am beginer in this trade.
g.k.nagaraj.
|
|
| Back to top |
|
 |
Trade Master
White Belt

Joined: 27 Apr 2009
Posts: 44
|
Post: #42  Posted: Fri Jun 05, 2009 10:04 am Post subject: Re: intraday trade on trd\ macdo. Posted: Fri Jun 05, 2009 10:04 am Post subject: Re: intraday trade on trd\ macdo. |
 |
|
| knrajan31 wrote: | dear master i have read yr trading mrthod based on trd\macdo .referred ispat ind chart.which i am holdingat rs 25.75.
for day trade u have suggested 10mt tf based on 30\60 tfs.for direction of trend
the following are the readings on the end of trade on 4-6-09
t\f trd macdo
10 1.006 0.0041
30 1.01288 -0.05761 macdo showing after
completion of 3 1\2
hrs trade trade
till then it is 0
60 1.020 0 no reading for whole
day.
trd setting 15 macdo 12 26 9
pl let me know as to why o reading in macdo i 60 mtn t\f & in 30 mts t\f the macdo reading data is showing only after 1.30 pm . for tading in 10 mts t\f do you need to change settings in trd \ macdo .pl reply as i am beginer in this trade.
g.k.nagaraj. |
Hello sir
I think you need to increase the intraday time frame setting of your charts to greater than 10 days, if you need to watch 60 min charts. Pls do the same.
Thanx
TM
|
|
| Back to top |
|
 |
knrajan31
White Belt

Joined: 01 Apr 2009
Posts: 18
|
Post: #43  Posted: Sat Jun 06, 2009 6:14 am Post subject: trd\maxdo trend analysis Posted: Sat Jun 06, 2009 6:14 am Post subject: trd\maxdo trend analysis |
 |
|
dear sir thanks for yr reply. you mean
ntraday time frame setting of your charts to greater than 10 days, or 10 mts.
pl clarify.
also there is no reading of macdo in 60 mt t\f in any scrip
g.k.nagaraj.
|
|
| Back to top |
|
 |
Trade Master
White Belt

Joined: 27 Apr 2009
Posts: 44
|
Post: #44  Posted: Sat Jun 06, 2009 10:05 am Post subject: Re: trd\maxdo trend analysis Posted: Sat Jun 06, 2009 10:05 am Post subject: Re: trd\maxdo trend analysis |
 |
|
| knrajan31 wrote: | dear sir thanks for yr reply. you mean
ntraday time frame setting of your charts to greater than 10 days, or 10 mts.
pl clarify.
also there is no reading of macdo in 60 mt t\f in any scrip
g.k.nagaraj. |
Dear Mr Nagaraj
For viewing 60 min charts, 1st u increase the intraday time frame to at least 10 or more days...u'll get MACDO definately there...save the settings after increasing time frame and then log off and again log in after saving settings. If any further problems, u may contact PT/ST sir.
Thanx
TM
|
|
| Back to top |
|
 |
Trade Master
White Belt

Joined: 27 Apr 2009
Posts: 44
|
|
| Back to top |
|
 |
|

