| View previous topic :: View next topic |
| Author |
Trading based on "TREND DEVIATION" indicator |
Trade Master
White Belt

Joined: 27 Apr 2009
Posts: 44
|
Post: #1  Posted: Mon May 04, 2009 9:36 pm Post subject: Trading based on "TREND DEVIATION" indicator Posted: Mon May 04, 2009 9:36 pm Post subject: Trading based on "TREND DEVIATION" indicator |
 |
|
Hi Folks
Starting new thread for trading based on "Trend Deviation". ..
This works well with EOD, Weekly and Intraday chart frames for trading and gives very nice Entry level for both Longs and Shorts.
Entry trade signal:
Whenever the trendline crosses ONE level coming from downside, or turns up from ONE level itself while coming down from upside, initiate the LONG TRADE.
Similarly, Whenever the trendline crosses the ONE level coming from upside, or turns down from ONE level itself while coming up from downside, initiate the SHORT TRADE.
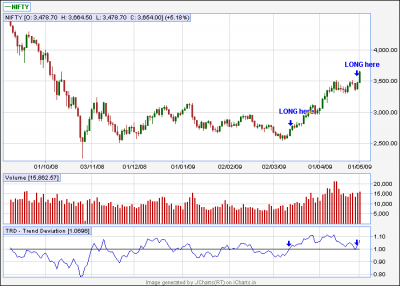
Giving a look at EOD Nifty chart, the Trend deviation was coming down and reached ONE level on 28th April 09. The next day was decisive and +ve close on 29th April 09 gave the trendline a bounce-back from ONE level, initiating LONG trade from the word GO !! And look what happened today (the next trading day)--180 points Jump !!!!!
Similarly, Last long in Nifty Spot was initiated on 13th March 09 @ 2720 Closing price.
Chart Pasted for refference.
Would like to receive comments/ queries on above mentioned Trade technique in future.
Thanx in Advance.
| Description: |
|
| Filesize: |
15.69 KB |
| Viewed: |
1686 Time(s) |
|
|
|
| Back to top |
|
 |
|
|
 |
kumars
White Belt

Joined: 07 Feb 2009
Posts: 3
|
Post: #2  Posted: Mon May 04, 2009 9:45 pm Post subject: "TREND DEVIATION" Posted: Mon May 04, 2009 9:45 pm Post subject: "TREND DEVIATION" |
 |
|
| which ever method u follow it sud give profits and nothing else.At last seeing profit is like seeing GOD.BEST OF LUCK
|
|
| Back to top |
|
 |
Trade Master
White Belt

Joined: 27 Apr 2009
Posts: 44
|
Post: #3  Posted: Tue May 05, 2009 10:04 am Post subject: Posted: Tue May 05, 2009 10:04 am Post subject: |
 |
|
Hi Keshav
Thanx for writing. ..Actually, your saying implies to all the trading systems, and not alone this one.  Anyways, the thread is for educating and sharing best practices of individuals. Hope, it will deliver the best. Anyways, the thread is for educating and sharing best practices of individuals. Hope, it will deliver the best.
Thanks
|
|
| Back to top |
|
 |
Trade Master
White Belt

Joined: 27 Apr 2009
Posts: 44
|
|
| Back to top |
|
 |
san77s
White Belt

Joined: 13 Jan 2009
Posts: 41
|
Post: #5  Posted: Tue May 05, 2009 7:43 pm Post subject: Posted: Tue May 05, 2009 7:43 pm Post subject: |
 |
|
Sir,
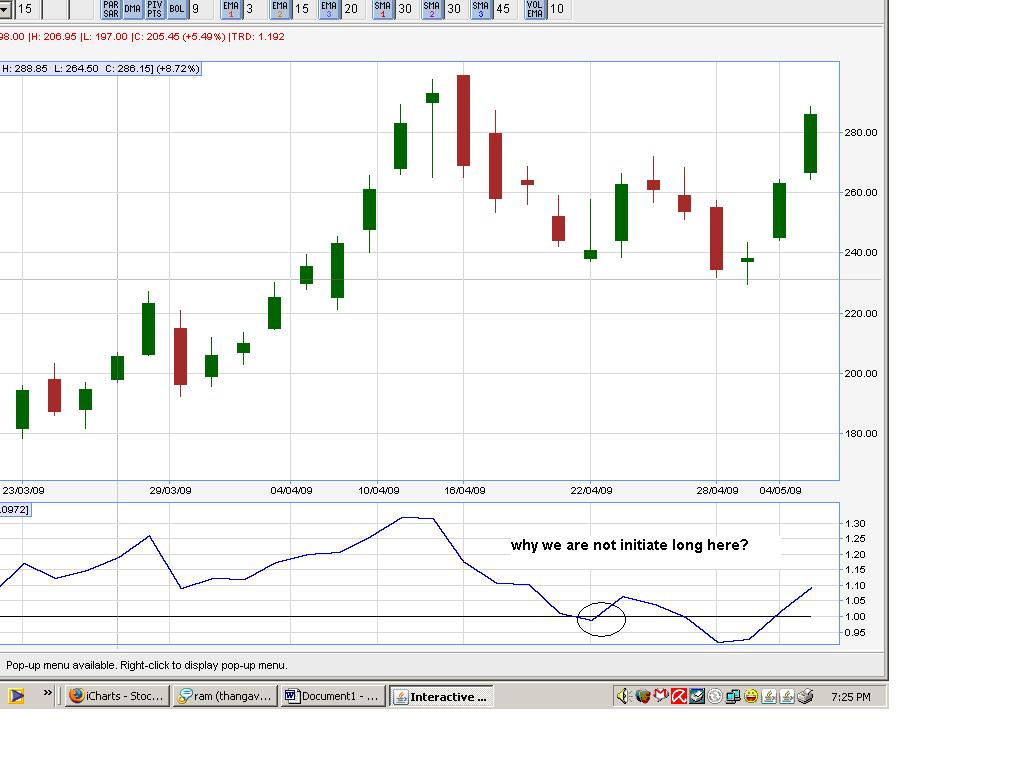
Why we are not initiate long on 22nd April ? pls explain.. is any other support indicator we have to look?
pls. share with us..
Regards,
S.Saravanan.
| Description: |
|
| Filesize: |
90.11 KB |
| Viewed: |
13421 Time(s) |
|
|
|
| Back to top |
|
 |
Trade Master
White Belt

Joined: 27 Apr 2009
Posts: 44
|
Post: #6  Posted: Wed May 06, 2009 10:41 am Post subject: Posted: Wed May 06, 2009 10:41 am Post subject: |
 |
|
Dear San
We could have initiated the long there... It zoomed from 240 odd to 270 in next two days.  Not a bad move all !!! Not a bad move all !!!
For support indicator, U can use as per your convinience as Trend Deviation gives Entry point only. Exit point as per this maybe below your buy zone in longs and vice-versa.
use this for entry only, and keep only 2-3 days swing for profits. 
thanks
|
|
| Back to top |
|
 |
Trade Master
White Belt

Joined: 27 Apr 2009
Posts: 44
|
Post: #7  Posted: Wed May 06, 2009 4:17 pm Post subject: Long Term tren view Posted: Wed May 06, 2009 4:17 pm Post subject: Long Term tren view |
 |
|
Hi Folks
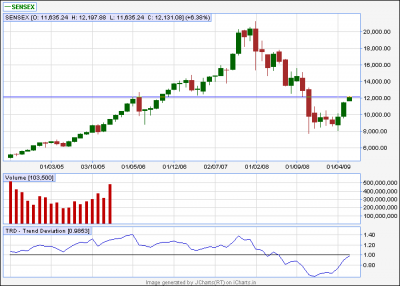
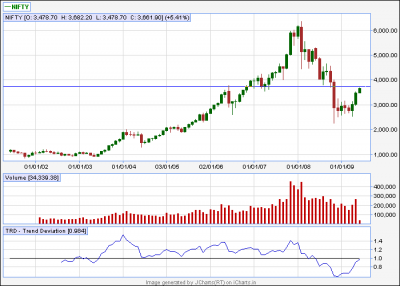
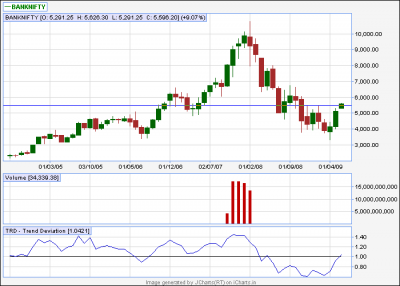
Posting "Monthly" SENSEX, NIFTY & BANK NIFTY Charts based on Trend Deviation...Whereas Nifty & Sensex are on a verge of kiss of Trend Deviation indicator @ 3750-3800 & 12000 approx levels, Bank Nifty has already broken the kiss zone and looking +ve to cross 6000-6500 levels soon.... Bank Nifty is major trendsetter for all market levels, as per me. 
Previous trend shows that Trend Deviation indicator has led the Upward or Downward journey on 2nd Attempt... The 1st one (upward crossing over) is almost here and any dip if there is in the market, should be used to BUY only. The LONG TERM strategy.
Thanks
| Description: |
|
| Filesize: |
13.46 KB |
| Viewed: |
788 Time(s) |
|
| Description: |
|
| Filesize: |
13.8 KB |
| Viewed: |
751 Time(s) |
|
| Description: |
|
| Filesize: |
12.24 KB |
| Viewed: |
811 Time(s) |
|
|
|
| Back to top |
|
 |
Trade Master
White Belt

Joined: 27 Apr 2009
Posts: 44
|
Post: #8  Posted: Wed May 06, 2009 9:41 pm Post subject: Posted: Wed May 06, 2009 9:41 pm Post subject: |
 |
|
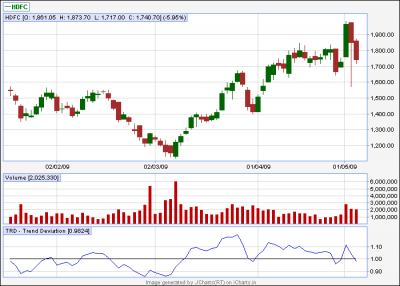
Posting another chart. HDFC EOD Chart of 6th May 09 (Today EOD)..The Trend deviation has crossed below 1, its 0.98 now..
Can Short HDFC for Swing... below today EOD closing levels (Cash rate 1740 with stop loss of 1760-1765)
Remember, the SL is reversible. If it crosses 1760-65-70, U can go long immediately..
Thanks
| Description: |
|
| Filesize: |
12.16 KB |
| Viewed: |
794 Time(s) |
|
|
|
| Back to top |
|
 |
ashutoshbpl
White Belt

Joined: 19 Jan 2009
Posts: 25
|
Post: #9  Posted: Wed May 06, 2009 11:52 pm Post subject: Posted: Wed May 06, 2009 11:52 pm Post subject: |
 |
|
Simply cute indicator, how come I never tried it????
Kudos to you for bringing in light this simple but quite powerful indicator.
|
|
| Back to top |
|
 |
Trade Master
White Belt

Joined: 27 Apr 2009
Posts: 44
|
Post: #10  Posted: Thu May 07, 2009 10:24 am Post subject: Posted: Thu May 07, 2009 10:24 am Post subject: |
 |
|
Thanx Ashu !
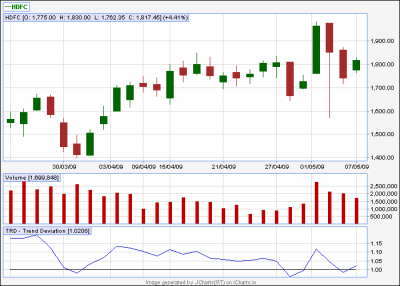
Anyways, HDFC straight away opened @ 1775, means no short and GO LONG STRAIGHT AWAY as per my strategy mentioned below. It has sustained 1 level and hoping for at least two green candles based on EOD Charts. For Longs, pls keep the SL as mentioned below and vice versa.
Thanx
|
|
| Back to top |
|
 |
Trade Master
White Belt

Joined: 27 Apr 2009
Posts: 44
|
Post: #11  Posted: Thu May 07, 2009 5:46 pm Post subject: Posted: Thu May 07, 2009 5:46 pm Post subject: |
 |
|
Hi guys
Just reviewing HDFC call given yesterday to Short below 1740, which didnt came today and opened @ 1775 straigh away.. As mentioned, in the call to go long above 1770, the fresh Longs were initiated at opening with SL 1740 and rocked throughout the day !! Posting today's EOD Chart with Trend Deviation again jumping back from 1 level, giving at least one/ two more green candles as target.
Thanx
| Description: |
|
| Filesize: |
14.1 KB |
| Viewed: |
739 Time(s) |
|
|
|
| Back to top |
|
 |
sandew
White Belt

Joined: 02 Feb 2009
Posts: 174
|
Post: #12  Posted: Thu May 07, 2009 6:07 pm Post subject: MACD Histogram and TD Posted: Thu May 07, 2009 6:07 pm Post subject: MACD Histogram and TD |
 |
|
MACD Histogram / forest and the Trend Deviation is one and same - put the two charts together and check the similarities.
Regards
|
|
| Back to top |
|
 |
Trade Master
White Belt

Joined: 27 Apr 2009
Posts: 44
|
Post: #13  Posted: Fri May 08, 2009 8:32 pm Post subject: Posted: Fri May 08, 2009 8:32 pm Post subject: |
 |
|
Hi guys,
So HDFC after hitting 1830 around gets hammering, as for all stocks today. Below 1760 again gave shorting opportunity and closed at 1736 today.
Again, shorting opportunity exists if open around 1730-1745, with SL of 1760-65.. (SL's are reversible)
Thanx
|
|
| Back to top |
|
 |
latinoholic
White Belt

Joined: 21 Jul 2007
Posts: 6
|
Post: #14  Posted: Fri May 08, 2009 10:39 pm Post subject: Posted: Fri May 08, 2009 10:39 pm Post subject: |
 |
|
what is the logic code for making this trend deviation indicator..
is it based on moving average.. to calculate the levels...
|
|
| Back to top |
|
 |
latinoholic
White Belt

Joined: 21 Jul 2007
Posts: 6
|
Post: #15  Posted: Fri May 08, 2009 10:41 pm Post subject: Posted: Fri May 08, 2009 10:41 pm Post subject: |
 |
|
Trend Deviation (Price Oscillator)
Trend Deviation also known as Price Oscillator in some charting packages.
A trend deviation indicator is obtained by dividing or subtracting a security's price by a measure of trend, which is usually a form of MA. It is also possible to base a trend deviation using linear regression techniques. However, we will concentrate on the MA method here. This approach is also called a price oscillator in some charting packages.
There are two methods of calculation: subtraction and division. Division is preferred, since it is more reflective of proportionate moves. Since the average represents the trend being monitored, this oscillator indicates how fast the price is advancing or declining in relation to that trend. An oscillator based on a trend-deviation calculation is, in fact, a horizontal representation of the envelope analysis, but in this graphic format, it also shows subtle changes of underlying technical strength and weakness.
|
|
| Back to top |
|
 |
|

