|
|
| View previous topic :: View next topic |
| Author |
Trading Divergences... |
singh.ravee
Yellow Belt

Joined: 12 Aug 2010
Posts: 678
|
Post: #106  Posted: Wed Feb 02, 2011 10:54 am Post subject: Posted: Wed Feb 02, 2011 10:54 am Post subject: |
 |
|
thank u so much for your reply.
candlestick point noted.
regards
ravee
|
|
| Back to top |
|
 |
|
|  |
casper
Green Belt

Joined: 02 Oct 2010
Posts: 1315
|
Post: #107  Posted: Wed Feb 02, 2011 11:18 am Post subject: Posted: Wed Feb 02, 2011 11:18 am Post subject: |
 |
|
| Ravi_S wrote: | Singh.ravee, i noticed the divergence yesterday and entered at 900, today came out at 921.5... As I said I'm not good in candlesticks... 
| singh.ravee wrote: | Ravi gm,
i m attaching 60min reliance chart.
there is a morning star as well as bullish divergence.
can we go long.
your valuable comments please.
regards
ravee |
|
as u said u r not good in candle stick, but most of the time, in various threads, i have seen u bagging good trades regularly,
what else a trader can want?
|
|
| Back to top |
|
 |
Ravi_S
Yellow Belt

Joined: 15 Jun 2009
Posts: 569
|
Post: #108  Posted: Wed Feb 02, 2011 12:40 pm Post subject: Posted: Wed Feb 02, 2011 12:40 pm Post subject: |
 |
|
Casper 
| casper wrote: | | Ravi_S wrote: | Singh.ravee, i noticed the divergence yesterday and entered at 900, today came out at 921.5... As I said I'm not good in candlesticks... 
| singh.ravee wrote: | Ravi gm,
i m attaching 60min reliance chart.
there is a morning star as well as bullish divergence.
can we go long.
your valuable comments please.
regards
ravee |
|
as u said u r not good in candle stick, but most of the time, in various threads, i have seen u bagging good trades regularly,
what else a trader can want? |
|
|
| Back to top |
|
 |
Padkondu
White Belt

Joined: 23 Jan 2008
Posts: 120
|
Post: #109  Posted: Wed Feb 02, 2011 12:46 pm Post subject: yesbank divergnece Posted: Wed Feb 02, 2011 12:46 pm Post subject: yesbank divergnece |
 |
|
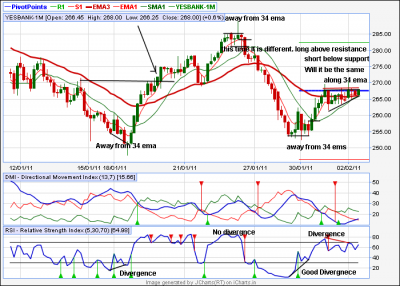
dear friends
in the following chart yes bank showed the habbit of obeying divergences. but in previous cases the price was much away from the 34 ema, a place where a reversal can be expected. but this time the divergence formed along the ema. hope this time is both long and short case. please check up and advice. i made profit two times using divergence. but this time i am doubtful about using divergence, rather follow the pattern.
regards
padkondu
| Description: |
| 60 min, rsi(5) divergence |
|
| Filesize: |
42.58 KB |
| Viewed: |
474 Time(s) |
|
|
|
| Back to top |
|
 |
casper
Green Belt

Joined: 02 Oct 2010
Posts: 1315
|
Post: #110  Posted: Wed Feb 02, 2011 1:14 pm Post subject: Re: yesbank divergnece Posted: Wed Feb 02, 2011 1:14 pm Post subject: Re: yesbank divergnece |
 |
|
| Padkondu wrote: | dear friends
in the following chart yes bank showed the habbit of obeying divergences. but in previous cases the price was much away from the 34 ema, a place where a reversal can be expected. but this time the divergence formed along the ema. hope this time is both long and short case. please check up and advice. i made profit two times using divergence. but this time i am doubtful about using divergence, rather follow the pattern.
regards
padkondu |
whts ur rsi setting? my rsi is not showing any div. but we have strong resi in upper level as weekly piv and 89 ema is present here
|
|
| Back to top |
|
 |
Padkondu
White Belt

Joined: 23 Jan 2008
Posts: 120
|
Post: #111  Posted: Wed Feb 02, 2011 1:43 pm Post subject: Re: yesbank divergnece Posted: Wed Feb 02, 2011 1:43 pm Post subject: Re: yesbank divergnece |
 |
|
| casper wrote: | | Padkondu wrote: | dear friends
in the following chart yes bank showed the habbit of obeying divergences. but in previous cases the price was much away from the 34 ema, a place where a reversal can be expected. but this time the divergence formed along the ema. hope this time is both long and short case. please check up and advice. i made profit two times using divergence. but this time i am doubtful about using divergence, rather follow the pattern.
regards
padkondu |
whts ur rsi setting? my rsi is not showing any div. but we have strong resi in upper level as weekly piv and 89 ema is present here |
Hi casper!
HOW ARE YOU NOW?
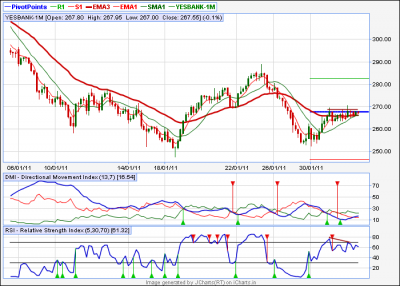
look at the red lines (in the chart), at the top or the price pattern and negetive divergence of rsi 5period on 60 min chart. but the price pattern indicates upward pressure resisted by the weekly pivot. so it is a long above weekly pivot on closing basis and short below the break of previous swing low. am i right? please guide.
padkondu
| Description: |
|
| Filesize: |
37.38 KB |
| Viewed: |
447 Time(s) |
|
|
|
| Back to top |
|
 |
casper
Green Belt

Joined: 02 Oct 2010
Posts: 1315
|
Post: #112  Posted: Wed Feb 02, 2011 2:31 pm Post subject: Posted: Wed Feb 02, 2011 2:31 pm Post subject: |
 |
|
| hi brother, u r almost right, just for long, wait until a close above 89 ema too, its also a strong level
|
|
| Back to top |
|
 |
Padkondu
White Belt

Joined: 23 Jan 2008
Posts: 120
|
Post: #113  Posted: Wed Feb 02, 2011 2:52 pm Post subject: Posted: Wed Feb 02, 2011 2:52 pm Post subject: |
 |
|
| casper wrote: | | hi brother, u r almost right, just for long, wait until a close above 89 ema too, its also a strong level |
yes casper!
waiting for a strong close above 89 ema. i was doubtful about the divergence, and it was proved. but as a matter of fact looking for a long in bear rally is a sin.
tks
padkondu
|
|
| Back to top |
|
 |
girishhu1
White Belt

Joined: 17 Aug 2009
Posts: 316
|
Post: #114  Posted: Wed Feb 02, 2011 7:29 pm Post subject: Re: yesbank divergnece Posted: Wed Feb 02, 2011 7:29 pm Post subject: Re: yesbank divergnece |
 |
|
| Padkondu wrote: | dear friends
in the following chart yes bank showed the habbit of obeying divergences. but in previous cases the price was much away from the 34 ema, a place where a reversal can be expected. but this time the divergence formed along the ema. hope this time is both long and short case. please check up and advice. i made profit two times using divergence. but this time i am doubtful about using divergence, rather follow the pattern.
regards
padkondu |
dear padkondu,
from whatever little i understand from various threads, it should be long above resistance and short below support holds in bullish phase only.in bearish phase like at present, it should be exactly opposite.
regards,
girish
|
|
| Back to top |
|
 |
chetan83
Brown Belt

Joined: 19 Feb 2010
Posts: 2037
|
|
| Back to top |
|
 |
singh.ravee
Yellow Belt

Joined: 12 Aug 2010
Posts: 678
|
Post: #116  Posted: Wed Feb 02, 2011 11:45 pm Post subject: Posted: Wed Feb 02, 2011 11:45 pm Post subject: |
 |
|
chetan,
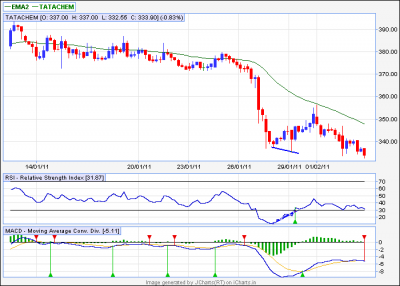
in eod chart tata chem has broken 340= a long term support. tomm session will tell is it a puncture below support or broken below support.
in the chart that u posted, the last candle is not a bottom since for a bottom a bearish candle should be followed by a bullish candle. one bullish divergence i have tried to drawn, which is already discounted.
the last candle has a new low for the move. i think playing on the short side will be a better option.
Ravi, kindly correct me, if i m making a mistake.
thanks and regards
ravee
| Description: |
|
| Filesize: |
11.99 KB |
| Viewed: |
523 Time(s) |
|
|
|
| Back to top |
|
 |
chetan83
Brown Belt

Joined: 19 Feb 2010
Posts: 2037
|
Post: #117  Posted: Thu Feb 03, 2011 11:29 am Post subject: TATA CHEMICAL - DARE TO TRADE Posted: Thu Feb 03, 2011 11:29 am Post subject: TATA CHEMICAL - DARE TO TRADE |
 |
|
| singh.ravee wrote: | chetan,
in eod chart tata chem has broken 340= a long term support. tomm session will tell is it a puncture below support or broken below support.
in the chart that u posted, the last candle is not a bottom since for a bottom a bearish candle should be followed by a bullish candle. one bullish divergence i have tried to drawn, which is already discounted.
the last candle has a new low for the move. i think playing on the short side will be a better option.
Ravi, kindly correct me, if i m making a mistake.
thanks and regards
ravee |
Hi Ravee,
Mata ka naam leke, Now I am bullish here in Tata Chem at 338 for at least 342. Pls cross check the chart in 60 mins, + ive divergence now. Confirmed with casper too, Late to post chart, as had IT issue at my office, now resolved.
Regards,
Chetan.
| Description: |
|
| Filesize: |
472.68 KB |
| Viewed: |
562 Time(s) |
|
Last edited by chetan83 on Thu Feb 03, 2011 11:38 am; edited 1 time in total |
|
| Back to top |
|
 |
singh.ravee
Yellow Belt

Joined: 12 Aug 2010
Posts: 678
|
|
| Back to top |
|
 |
HPS AHUJA
White Belt

Joined: 02 Dec 2010
Posts: 1
|
Post: #119  Posted: Wed Feb 09, 2011 3:47 pm Post subject: Posted: Wed Feb 09, 2011 3:47 pm Post subject: |
 |
|
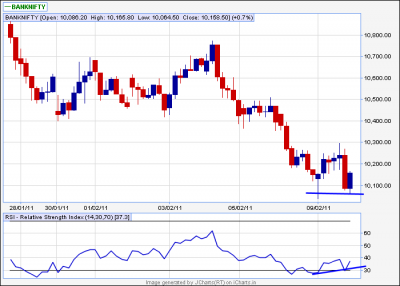
Ravi hello,
Is it a bullish divergence in bank nifty 60min.
thanks and regards
ravee
| Description: |
|
| Filesize: |
14.39 KB |
| Viewed: |
528 Time(s) |
|
|
|
| Back to top |
|
 |
Ravi_S
Yellow Belt

Joined: 15 Jun 2009
Posts: 569
|
Post: #120  Posted: Wed Feb 09, 2011 3:51 pm Post subject: Posted: Wed Feb 09, 2011 3:51 pm Post subject: |
 |
|
Yes it is... But as sherbaaz said, in a trending market beware....
| HPS AHUJA wrote: | Ravi hello,
Is it a bullish divergence in bank nifty 60min.
thanks and regards
ravee |
|
|
| Back to top |
|
 |
|
|
You cannot post new topics in this forum
You cannot reply to topics in this forum
You cannot edit your posts in this forum
You cannot delete your posts in this forum
You cannot vote in polls in this forum
You can attach files in this forum
You can download files in this forum
|
Powered by phpBB © 2001, 2005 phpBB Group
|
|
|

