| View previous topic :: View next topic |
| Author |
Trading Divergences... |
sherbaaz
Yellow Belt

Joined: 27 May 2009
Posts: 543
|
Post: #136  Posted: Thu Feb 17, 2011 12:56 pm Post subject: Posted: Thu Feb 17, 2011 12:56 pm Post subject: |
 |
|
| singh.ravee wrote: | Hello everybody,
Is it a bearish divergence in bank nifty 60min?
It appears at monthly pivot point. Also there is a confluence of 200sma and 50ema around 11000.
Bears are u ready to push it down???
Thanks and Regards
Ravee |
Hi,
Hope you have not taken the short position here on the basis of divergence.
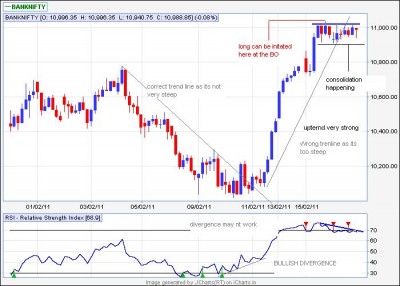
BNF is in strong uptrend on your chart there is no meaningful retracement still in it. Instead it formed a congestion with false bearish divergence to trap ppl on the wrong side that is in SHORTS.
I am attaching a chart with my understanding. also note why the previous bullish div worked.
regds,
|
|
| Back to top |
|
 |
|
|
 |
sherbaaz
Yellow Belt

Joined: 27 May 2009
Posts: 543
|
Post: #137  Posted: Thu Feb 17, 2011 1:01 pm Post subject: Posted: Thu Feb 17, 2011 1:01 pm Post subject: |
 |
|
Hi,
Hope you have not taken the short position here on the basis of divergence.
BNF is in strong uptrend on your chart there is no meaningful retracement still in it. Instead it formed a congestion with false bearish divergence to trap ppl on the wrong side that is in SHORTS.
I am attaching a chart with my understanding. also note why the previous bullish div worked.
regds,
|
|
| Back to top |
|
 |
sherbaaz
Yellow Belt

Joined: 27 May 2009
Posts: 543
|
Post: #138  Posted: Thu Feb 17, 2011 1:02 pm Post subject: Posted: Thu Feb 17, 2011 1:02 pm Post subject: |
 |
|
Hi,
Hope you have not taken the short position here on the basis of divergence.
BNF is in strong uptrend on your chart there is no meaningful retracement still in it. Instead it formed a congestion with false bearish divergence to trap ppl on the wrong side that is in SHORTS.
I am attaching a chart with my understanding. also note why the previous bullish div worked.
regds,
|
|
| Back to top |
|
 |
sherbaaz
Yellow Belt

Joined: 27 May 2009
Posts: 543
|
Post: #139  Posted: Thu Feb 17, 2011 1:03 pm Post subject: Posted: Thu Feb 17, 2011 1:03 pm Post subject: |
 |
|
Hi,
Hope you have not taken the short position here on the basis of divergence.
BNF is in strong uptrend on your chart there is no meaningful retracement still in it. Instead it formed a congestion with false bearish divergence to trap ppl on the wrong side that is in SHORTS.
I am attaching a chart with my understanding. also note why the previous bullish div worked.
regds,
Last edited by sherbaaz on Thu Feb 17, 2011 2:47 pm; edited 2 times in total |
|
| Back to top |
|
 |
tripathi_manu
White Belt

Joined: 27 Dec 2008
Posts: 62
|
Post: #140  Posted: Thu Feb 17, 2011 5:46 pm Post subject: Posted: Thu Feb 17, 2011 5:46 pm Post subject: |
 |
|
| sherbaaz wrote: | Hi,
Hope you have not taken the short position here on the basis of divergence.
BNF is in strong uptrend on your chart there is no meaningful retracement still in it. Instead it formed a congestion with false bearish divergence to trap ppl on the wrong side that is in SHORTS.
I am attaching a chart with my understanding. also note why the previous bullish div worked.
regds, |
where is the chart ?
manu
|
|
| Back to top |
|
 |
sherbaaz
Yellow Belt

Joined: 27 May 2009
Posts: 543
|
Post: #141  Posted: Thu Feb 17, 2011 6:59 pm Post subject: Posted: Thu Feb 17, 2011 6:59 pm Post subject: |
 |
|
| tripathi_manu wrote: | | sherbaaz wrote: | Hi,
Hope you have not taken the short position here on the basis of divergence.
BNF is in strong uptrend on your chart there is no meaningful retracement still in it. Instead it formed a congestion with false bearish divergence to trap ppl on the wrong side that is in SHORTS.
I am attaching a chart with my understanding. also note why the previous bullish div worked.
regds, |
where is the chart ?
manu |
CHART
regds,
| Description: |
|
| Filesize: |
62.87 KB |
| Viewed: |
538 Time(s) |

|
|
|
| Back to top |
|
 |
singh.ravee
Yellow Belt

Joined: 12 Aug 2010
Posts: 678
|
Post: #142  Posted: Thu Feb 17, 2011 7:18 pm Post subject: Posted: Thu Feb 17, 2011 7:18 pm Post subject: |
 |
|
Sherbaaz bhai,
Thank you so much for showing concern.
Today, I didn't opened short in bank nifty. The chart I posted on banknifty 60 min held my view of yesterday night. In the morning I could see banknifty eod chart with marked decrease in volume. I became slightly suspicious. Revisited steve and was able to identify it as a lateral zone. Could not go long after the upward breakout because of business committments.
Same happened in nifty fno which I shorted yesterday. Exited at the first opportunity in the morning itself with npnl.
A stitch in time saves nine. 
Regards
Ravee
|
|
| Back to top |
|
 |
singh.ravee
Yellow Belt

Joined: 12 Aug 2010
Posts: 678
|
Post: #143  Posted: Thu Feb 17, 2011 7:49 pm Post subject: Posted: Thu Feb 17, 2011 7:49 pm Post subject: |
 |
|
Sherbaaz,
If I have understood your chart properly, you wish to point out following;
1. in the period, close to bottom, where you have marked "bullish divergence", a down tl was broken on the upside also the prices caught upward spiral, hence we can conclude that the divergence is working.
2. In the period marked by me as bearish divergence following observations can be made
a) trendline is too steep hence not a valid trendline.
b) after breaking false tl on the downside prices failed to move down. so chances of failure of this divergence is high.
Thanks and Regards
ravee
|
|
| Back to top |
|
 |
singh.ravee
Yellow Belt

Joined: 12 Aug 2010
Posts: 678
|
Post: #144  Posted: Thu Feb 17, 2011 8:27 pm Post subject: Posted: Thu Feb 17, 2011 8:27 pm Post subject: |
 |
|
One more point,
Just now finished reading initial write-up of "Ravi" and saw the attached picture.
A double top combined with falling RSI = bearish divergence.
In bank nifty, I think we lack clearly defined double top also.
thanks and regards
ravee
|
|
| Back to top |
|
 |
sherbaaz
Yellow Belt

Joined: 27 May 2009
Posts: 543
|
Post: #145  Posted: Thu Feb 17, 2011 8:53 pm Post subject: Posted: Thu Feb 17, 2011 8:53 pm Post subject: |
 |
|
| singh.ravee wrote: | Sherbaaz bhai,
Thank you so much for showing concern.
Today, I didn't opened short in bank nifty. The chart I posted on banknifty 60 min held my view of yesterday night. In the morning I could see banknifty eod chart with marked decrease in volume. I became slightly suspicious. Revisited steve and was able to identify it as a lateral zone. Could not go long after the upward breakout because of business committments.
Same happened in nifty fno which I shorted yesterday. Exited at the first opportunity in the morning itself with npnl.
A stitch in time saves nine. 
Regards
Ravee |
for me only one thing is imp on chart and ie PRICE forget about rest of the things div and all trade price and see price.
regds,
|
|
| Back to top |
|
 |
singh.ravee
Yellow Belt

Joined: 12 Aug 2010
Posts: 678
|
Post: #146  Posted: Thu Feb 17, 2011 11:09 pm Post subject: Posted: Thu Feb 17, 2011 11:09 pm Post subject: |
 |
|
sherbaaz,
does price = candles only without any indicator, what u normally refer as naked trading.
regards
ravee
|
|
| Back to top |
|
 |
sherbaaz
Yellow Belt

Joined: 27 May 2009
Posts: 543
|
Post: #147  Posted: Fri Feb 18, 2011 8:17 am Post subject: Posted: Fri Feb 18, 2011 8:17 am Post subject: |
 |
|
| singh.ravee wrote: | sherbaaz,
does price = candles only without any indicator, what u normally refer as naked trading.
regards
ravee |
hi,
candlesticks are way of presentation of greed and fear on chart on the basis of price.
yes NAKED TRADING is trading without any indicator/oscillator. it mostly simple price action (that may include candlesticks pattern also, but not necessary) on chart and keeping your mind also naked without and presumptions and assumptions.
try to listen wht price is telling u. be good listener.
regards,
|
|
| Back to top |
|
 |
singh.ravee
Yellow Belt

Joined: 12 Aug 2010
Posts: 678
|
Post: #148  Posted: Fri Feb 18, 2011 8:46 am Post subject: Posted: Fri Feb 18, 2011 8:46 am Post subject: |
 |
|
Sherbaaz hello,
I am asking another favour from you.
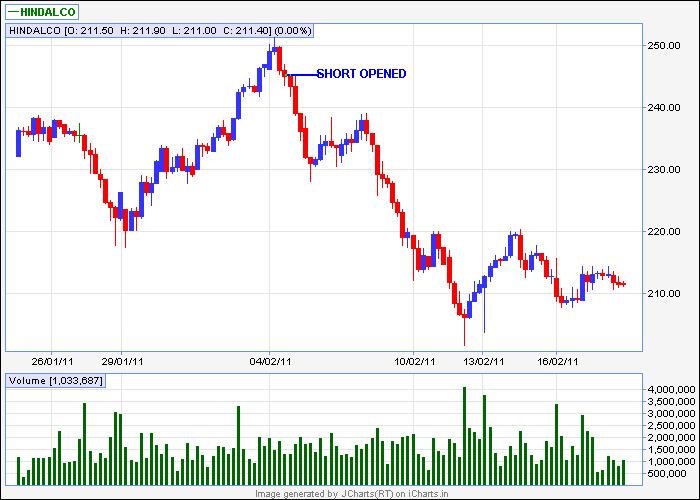
I am attaching hindalco 60min chart. I wish to improve upon one aspect of my trading i.e. "How long to stay with trade." I am more or less ok in identifying trend change however very weak in understanding how that trend needs to be played.
Please spare some time, as and when possible for you, to share "how u would have played this short trade in hindalco." or any other trade that u wish to share.
Kindly mark.
1. trailing sl points on chart.
2. if short was covered in between and reopend at any other price level.
Thanks and Regards
ravee
| Description: |
|
| Filesize: |
9.37 KB |
| Viewed: |
2413 Time(s) |

|
|
|
| Back to top |
|
 |
sherbaaz
Yellow Belt

Joined: 27 May 2009
Posts: 543
|
Post: #149  Posted: Fri Feb 18, 2011 9:17 am Post subject: Posted: Fri Feb 18, 2011 9:17 am Post subject: |
 |
|
| singh.ravee wrote: | Sherbaaz hello,
I am asking another favour from you.
I am attaching hindalco 60min chart. I wish to improve upon one aspect of my trading i.e. "How long to stay with trade." I am more or less ok in identifying trend change however very weak in understanding how that trend needs to be played.
Please spare some time, as and when possible for you, to share "how u would have played this short trade in hindalco." or any other trade that u wish to share.
Kindly mark.
1. trailing sl points on chart.
2. if short was covered in between and reopend at any other price level.
Thanks and Regards
ravee |
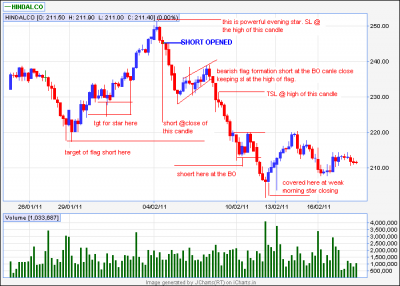
Hi,
Attached is the chart with necessary points. Do remember this is as per this chart price action it may or may not work on another chart with different price action.
regds,
| Description: |
|
| Filesize: |
24.77 KB |
| Viewed: |
579 Time(s) |

|
|
|
| Back to top |
|
 |
singh.ravee
Yellow Belt

Joined: 12 Aug 2010
Posts: 678
|
Post: #150  Posted: Fri Feb 18, 2011 9:20 am Post subject: Posted: Fri Feb 18, 2011 9:20 am Post subject: |
 |
|
sherbaaz bhai
thank u so much for your reply
regard
ravee
|
|
| Back to top |
|
 |
|

