| View previous topic :: View next topic |
| Author |
Trading Divergences... |
chetan83
Brown Belt

Joined: 19 Feb 2010
Posts: 2037
|
Post: #181  Posted: Fri Aug 10, 2012 6:31 pm Post subject: Posted: Fri Aug 10, 2012 6:31 pm Post subject: |
 |
|
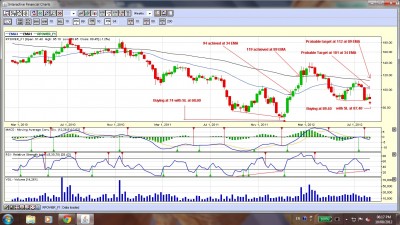
Past history is not sure to deliver the desired result.
Buy RPOWER Future or buy in cash.....be strict with SL as it is a weekly chart, so target may come by september'12.
| Description: |
|
| Filesize: |
352.42 KB |
| Viewed: |
663 Time(s) |
|
Last edited by chetan83 on Tue Aug 14, 2012 12:13 am; edited 1 time in total |
|
| Back to top |
|
 |
|
|
 |
prabit
White Belt

Joined: 02 Jul 2009
Posts: 133
|
Post: #182  Posted: Sat Aug 11, 2012 8:59 am Post subject: Posted: Sat Aug 11, 2012 8:59 am Post subject: |
 |
|
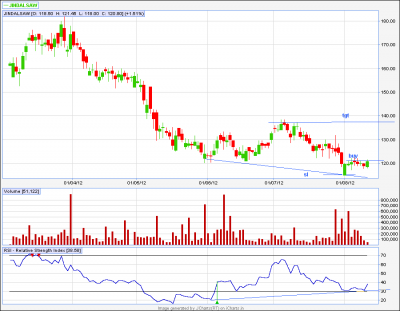
Hi friends, posting 1st time. Chetan, pl check is it correct?
| Description: |
|
| Filesize: |
15.19 KB |
| Viewed: |
618 Time(s) |
|
|
|
| Back to top |
|
 |
chetan83
Brown Belt

Joined: 19 Feb 2010
Posts: 2037
|
Post: #183  Posted: Sat Aug 11, 2012 8:48 pm Post subject: Posted: Sat Aug 11, 2012 8:48 pm Post subject: |
 |
|
| prabit wrote: | | Hi friends, posting 1st time. Chetan, pl check is it correct? |
Hi Prabit,
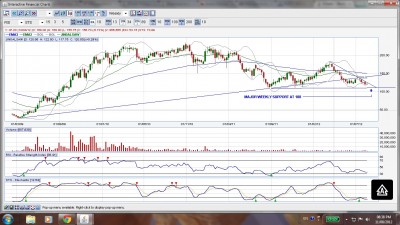
Divergence here is OK, at least if u refer the weekly chart (i have posted the same), picture is bit different. Even for divergence to take place in weekly chart, U need a green candle, to go long with SL at 108, which is the major support. If u look closely, it is a Descending triangle formation in weekly chart, so for any long at least a close abv 125 would be necessary. If u r a positional player and dont want to take risk by playing in Future, invest in equity now at this level.
Abv 125, targets can be 138 and 150 for short term.
regards,
Chetan.
| Description: |
|
| Filesize: |
339.33 KB |
| Viewed: |
595 Time(s) |
|
|
|
| Back to top |
|
 |
chetan83
Brown Belt

Joined: 19 Feb 2010
Posts: 2037
|
Post: #184  Posted: Tue Aug 14, 2012 12:12 am Post subject: Posted: Tue Aug 14, 2012 12:12 am Post subject: |
 |
|
| chetan83 wrote: | Past history is not sure to deliver the desired result.
Buy RPOWER Future or buy in cash.....be strict with SL as it is a weekly chart, so target may come by september'12. |
Rpower Fut low 89.05 and High 93.45
|
|
| Back to top |
|
 |
chetan83
Brown Belt

Joined: 19 Feb 2010
Posts: 2037
|
Post: #185  Posted: Tue Aug 14, 2012 11:35 pm Post subject: Posted: Tue Aug 14, 2012 11:35 pm Post subject: |
 |
|
| chetan83 wrote: | | chetan83 wrote: | Past history is not sure to deliver the desired result.
Buy RPOWER Future or buy in cash.....be strict with SL as it is a weekly chart, so target may come by september'12. |
Rpower Fut low 89.05 and High 93.45 |
Rpower Fut low 91.05 and High 94.10
|
|
| Back to top |
|
 |
chennuru
White Belt

Joined: 07 Jan 2011
Posts: 93
|
Post: #186  Posted: Wed Aug 15, 2012 10:19 am Post subject: Posted: Wed Aug 15, 2012 10:19 am Post subject: |
 |
|
Dear All
Trading based on divergence between price and indicators is liitle complecated,but very interesting.
I really like it,
especially for trending stocks, i follow the hidden divergence, which i likes very much.
hidden divergence is good option to find out whether the existing trend continues or not.
experts comments are welcome.
thanks
chennuru
|
|
| Back to top |
|
 |
chetan83
Brown Belt

Joined: 19 Feb 2010
Posts: 2037
|
Post: #187  Posted: Wed Aug 15, 2012 11:20 am Post subject: Posted: Wed Aug 15, 2012 11:20 am Post subject: |
 |
|
| chennuru wrote: | Dear All
Trading based on divergence between price and indicators is liitle complecated,but very interesting.
I really like it,
especially for trending stocks, i follow the hidden divergence, which i likes very much.
hidden divergence is good option to find out whether the existing trend continues or not.
experts comments are welcome.
thanks
chennuru |
Hi Chennuru,
Pls throw some example to support your view.
Chetan.
|
|
| Back to top |
|
 |
chetan83
Brown Belt

Joined: 19 Feb 2010
Posts: 2037
|
Post: #188  Posted: Sat Aug 25, 2012 2:00 pm Post subject: Posted: Sat Aug 25, 2012 2:00 pm Post subject: |
 |
|
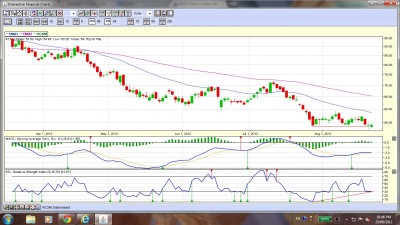
RCOM could be silent dark horse in coming week.....
SL - 52, CMP - 54.15, T - 58, 63......
| Description: |
|
| Filesize: |
305.73 KB |
| Viewed: |
574 Time(s) |
|
|
|
| Back to top |
|
 |
chennuru
White Belt

Joined: 07 Jan 2011
Posts: 93
|
Post: #189  Posted: Mon Aug 27, 2012 2:12 am Post subject: Posted: Mon Aug 27, 2012 2:12 am Post subject: |
 |
|
GOOD observation,
i agree with ur set up.
|
|
| Back to top |
|
 |
brindan71
White Belt

Joined: 28 Feb 2012
Posts: 3
|
Post: #190  Posted: Mon Aug 27, 2012 12:47 pm Post subject: Divergence Trading Posted: Mon Aug 27, 2012 12:47 pm Post subject: Divergence Trading |
 |
|
| Dear All-- I am a fan of divergence trading but for Nifty- What time frame is ideal.??Also how to discount the gap up or gap down on the candles which can be mis-leading at times??
|
|
| Back to top |
|
 |
chennuru
White Belt

Joined: 07 Jan 2011
Posts: 93
|
Post: #191  Posted: Tue Aug 28, 2012 12:01 am Post subject: Posted: Tue Aug 28, 2012 12:01 am Post subject: |
 |
|
Dear
Check with diffrent time frames with different settings, and in diffrent indicators,
dont see only one,
this can SOLVE ur issue,
but not 100%
CHENNURU
|
|
| Back to top |
|
 |
brindan71
White Belt

Joined: 28 Feb 2012
Posts: 3
|
Post: #192  Posted: Tue Aug 28, 2012 7:20 pm Post subject: Divergence Trading Posted: Tue Aug 28, 2012 7:20 pm Post subject: Divergence Trading |
 |
|
Hi dear,
For bearish divergence identification should i connect the top of bullish candle and for for bullish divergence should i connect the bottoms of the bearish candle to be compared with the indicator for divergence ??
Please advise....
|
|
| Back to top |
|
 |
chetan83
Brown Belt

Joined: 19 Feb 2010
Posts: 2037
|
Post: #193  Posted: Tue Aug 28, 2012 8:20 pm Post subject: Re: Divergence Trading Posted: Tue Aug 28, 2012 8:20 pm Post subject: Re: Divergence Trading |
 |
|
| brindan71 wrote: | Hi dear,
For bearish divergence identification should i connect the top of bullish candle and for for bullish divergence should i connect the bottoms of the bearish candle to be compared with the indicator for divergence ??
Please advise.... |
very true, take the whole body including the tail......it can be compared with RSI, STS MACD as well.
|
|
| Back to top |
|
 |
chetan83
Brown Belt

Joined: 19 Feb 2010
Posts: 2037
|
Post: #194  Posted: Tue Aug 28, 2012 8:21 pm Post subject: Posted: Tue Aug 28, 2012 8:21 pm Post subject: |
 |
|
| chetan83 wrote: | RCOM could be silent dark horse in coming week.....
SL - 52, CMP - 54.15, T - 58, 63...... |
SL HIT exited.
|
|
| Back to top |
|
 |
jdpt
Yellow Belt

Joined: 25 Jun 2012
Posts: 806
|
Post: #195  Posted: Tue Aug 28, 2012 8:46 pm Post subject: Re: Divergence Trading Posted: Tue Aug 28, 2012 8:46 pm Post subject: Re: Divergence Trading |
 |
|
| chetan83 wrote: | | brindan71 wrote: | Hi dear,
For bearish divergence identification should i connect the top of bullish candle and for for bullish divergence should i connect the bottoms of the bearish candle to be compared with the indicator for divergence ??
Please advise.... |
very true, take the whole body including the tail......it can be compared with RSI, STS MACD as well. |
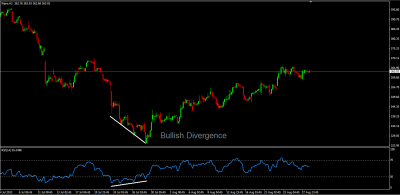
may this will helpful for you.
| Description: |
|
| Filesize: |
35.31 KB |
| Viewed: |
520 Time(s) |
|
| Description: |
|
| Filesize: |
34.42 KB |
| Viewed: |
529 Time(s) |

|
|
|
| Back to top |
|
 |
|

