| View previous topic :: View next topic |
| Author |
Trading Divergences... |
peace69
White Belt

Joined: 27 Aug 2009
Posts: 113
|
|
| Back to top |
|
 |
|
|
 |
Ravi_S
Yellow Belt

Joined: 15 Jun 2009
Posts: 569
|
|
| Back to top |
|
 |
jjm
White Belt

Joined: 17 Mar 2010
Posts: 411
|
Post: #48  Posted: Sat Jul 10, 2010 8:01 pm Post subject: Negative Div Posted: Sat Jul 10, 2010 8:01 pm Post subject: Negative Div |
 |
|
Dear All
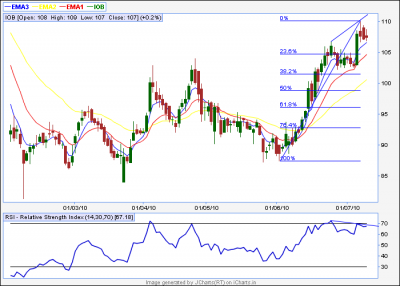
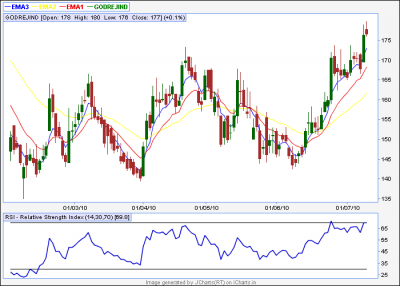
So many stock showing weakness in daily and weekly TF ...all very good - div
attached few charts for your perusals
List - future capi, VIP, IOB, Ingersoll rand, Baja auto fin, GODIND, Indian bank, voltamp, west cost paper, monnet ispat, persistant
It seams veeruji's call of Nifty 4700 will be achieved in coming days....
Regards,
Jeetu
| Description: |
|
| Filesize: |
34.66 KB |
| Viewed: |
507 Time(s) |
|
| Description: |
|
| Filesize: |
34.46 KB |
| Viewed: |
467 Time(s) |
|
|
|
| Back to top |
|
 |
Ravi_S
Yellow Belt

Joined: 15 Jun 2009
Posts: 569
|
Post: #49  Posted: Tue Jul 13, 2010 9:16 am Post subject: Bearish Divergence - Infosys Posted: Tue Jul 13, 2010 9:16 am Post subject: Bearish Divergence - Infosys |
 |
|
What a crash today... almost 3% down Infy... Enjoy those who have taken short positions...
| Ravi_S wrote: | Check the bearish divergence in Infy... QGM can throw more insights into this...  |

|
|
| Back to top |
|
 |
dcs2247
White Belt

Joined: 17 Mar 2010
Posts: 13
|
Post: #50  Posted: Tue Jul 13, 2010 10:12 am Post subject: Re: Bearish Divergence - Infosys Posted: Tue Jul 13, 2010 10:12 am Post subject: Re: Bearish Divergence - Infosys |
 |
|
[quote="Ravi_S"]What a crash today... almost 3% down Infy... Enjoy those who have taken short positions...
There was no divergence the day u put the Infosys chart. Also if we consider it a divergence it was negated yday only. See the chart.
Its different thing that it fall today quite badly. But divergence was not at all there.
regards
|
|
| Back to top |
|
 |
Ravi_S
Yellow Belt

Joined: 15 Jun 2009
Posts: 569
|
Post: #51  Posted: Tue Jul 13, 2010 2:15 pm Post subject: Divergence - Infy Posted: Tue Jul 13, 2010 2:15 pm Post subject: Divergence - Infy |
 |
|

|
|
| Back to top |
|
 |
sherbaaz
Yellow Belt

Joined: 27 May 2009
Posts: 543
|
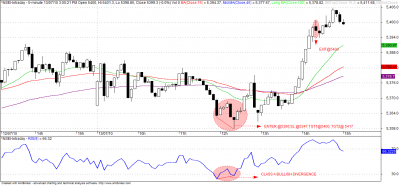
Post: #52  Posted: Tue Jul 13, 2010 4:21 pm Post subject: NIFTY SPOT DIV - 5 MIN TF Posted: Tue Jul 13, 2010 4:21 pm Post subject: NIFTY SPOT DIV - 5 MIN TF |
 |
|
NIFTY SPOT CLASS A BULLISH DIVERGENCE.
Regards,
| Description: |
|
| Filesize: |
47.81 KB |
| Viewed: |
541 Time(s) |
|
|
|
| Back to top |
|
 |
rvg
White Belt

Joined: 31 Oct 2006
Posts: 279
|
Post: #53  Posted: Tue Jul 13, 2010 6:33 pm Post subject: Re: Negative Div Posted: Tue Jul 13, 2010 6:33 pm Post subject: Re: Negative Div |
 |
|
| jjm wrote: |
So many stock showing weakness in daily and weekly TF ...all very good - div
|
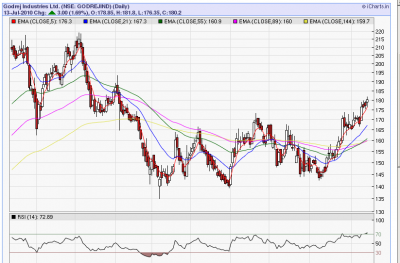
Looks like your -ve divergence in Godrej Industries has been negated.
| Description: |
|
| Filesize: |
61.05 KB |
| Viewed: |
471 Time(s) |
|
|
|
| Back to top |
|
 |
shekharinvest
Yellow Belt

Joined: 21 Dec 2007
Posts: 549
|
Post: #54  Posted: Wed Jul 14, 2010 6:50 pm Post subject: Posted: Wed Jul 14, 2010 6:50 pm Post subject: |
 |
|
Ravi,
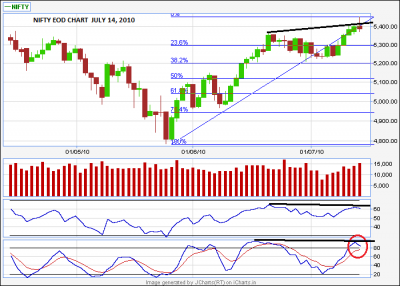
Here is a divergence for you.
Chart is nifty spot
Take entry only after STS crossover with Sl a few points above the high. TGTs can be 5200>5120>5040
SHEKHAR
| Description: |
|
| Filesize: |
24.56 KB |
| Viewed: |
556 Time(s) |
|
|
|
| Back to top |
|
 |
aromal
White Belt

Joined: 22 Mar 2010
Posts: 302
|
Post: #55  Posted: Wed Jul 14, 2010 8:57 pm Post subject: Posted: Wed Jul 14, 2010 8:57 pm Post subject: |
 |
|
| some then are not perfect nkv na? first two one
|
|
| Back to top |
|
 |
Ravi_S
Yellow Belt

Joined: 15 Jun 2009
Posts: 569
|
|
| Back to top |
|
 |
jitesh7
White Belt

Joined: 24 Dec 2009
Posts: 24
|
Post: #57  Posted: Thu Jul 15, 2010 8:10 pm Post subject: Posted: Thu Jul 15, 2010 8:10 pm Post subject: |
 |
|
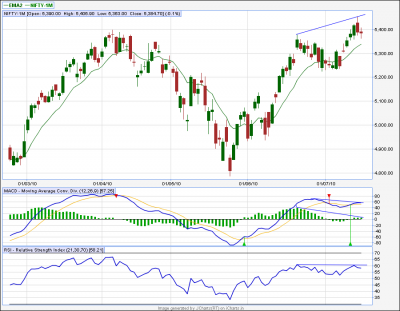
Negetive divergence is giving warning to go long NF.
| Description: |
|
| Filesize: |
38.39 KB |
| Viewed: |
493 Time(s) |
|
|
|
| Back to top |
|
 |
ridinghood
Yellow Belt

Joined: 16 Apr 2009
Posts: 724
|
Post: #58  Posted: Thu Jul 15, 2010 10:00 pm Post subject: Posted: Thu Jul 15, 2010 10:00 pm Post subject: |
 |
|
dear shekhar
pl elaborate on the sts cross over!
regs
ridinghood
|
|
| Back to top |
|
 |
bhd
White Belt

Joined: 21 Jun 2010
Posts: 3
|
Post: #59  Posted: Sat Jul 17, 2010 12:57 pm Post subject: Posted: Sat Jul 17, 2010 12:57 pm Post subject: |
 |
|
| aromal wrote: | | some then are not perfect nkv na? first two one |
 sir i m a strarter,can u help in understanding the techincal trading on daily basis,ie what parameters shld b applied fr intraday tradng.with rgards.bhd sir i m a strarter,can u help in understanding the techincal trading on daily basis,ie what parameters shld b applied fr intraday tradng.with rgards.bhd
|
|
| Back to top |
|
 |
shekharinvest
Yellow Belt

Joined: 21 Dec 2007
Posts: 549
|
Post: #60  Posted: Sat Jul 17, 2010 1:41 pm Post subject: Posted: Sat Jul 17, 2010 1:41 pm Post subject: |
 |
|
| ridinghood wrote: | dear shekhar
pl elaborate on the sts cross over!
regs
ridinghood |
ridinghood
Pl look at the lower portion of the chart in STS window I have marked area in red circle there are two lines one is red and another is blue.
In simple words when blue line crosses the red from below its a BUY signal and when the blue crosses from top it's a SELL signal.
STS is approaching a sell signal as marked on the chart whenever that happens go short.
If you need detailed info about Stochastic you can search on the net.
Lots of info there.
SHEKHAR
|
|
| Back to top |
|
 |
|

