| View previous topic :: View next topic |
| Author |
Trading Divergences... |
ridinghood
Yellow Belt

Joined: 16 Apr 2009
Posts: 724
|
Post: #61  Posted: Sat Jul 17, 2010 9:41 pm Post subject: Posted: Sat Jul 17, 2010 9:41 pm Post subject: |
 |
|
dear shekhar
thnx 4 ur kind response
regs
ridinghood
|
|
| Back to top |
|
 |
|
|
 |
sumesh_sol
Brown Belt

Joined: 06 Jun 2010
Posts: 2344
|
Post: #62  Posted: Sun Jul 18, 2010 2:05 pm Post subject: TVS Motors (Weekly Chart) Posted: Sun Jul 18, 2010 2:05 pm Post subject: TVS Motors (Weekly Chart) |
 |
|
Dear Shekhar Sir,
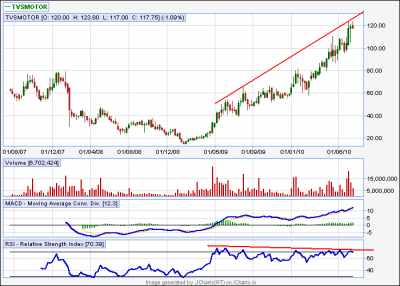
PLease find here WEEKLY chart of TVS Motors with -ve divergence..
Should we expect downtrend..??
Moreover, RSI(14) started remaining static from 40 level.. Can this be long time target..??
Regards,
Sumesh
| Description: |
|
| Filesize: |
25.66 KB |
| Viewed: |
460 Time(s) |
|
|
|
| Back to top |
|
 |
shekharinvest
Yellow Belt

Joined: 21 Dec 2007
Posts: 549
|
Post: #63  Posted: Sun Jul 18, 2010 9:44 pm Post subject: Re: TVS Motors (Weekly Chart) Posted: Sun Jul 18, 2010 9:44 pm Post subject: Re: TVS Motors (Weekly Chart) |
 |
|
| sumesh_sol wrote: | Dear Shekhar Sir,
PLease find here WEEKLY chart of TVS Motors with -ve divergence..
Should we expect downtrend..??
Moreover, RSI(14) started remaining static from 40 level.. Can this be long time target..??
Regards,
Sumesh |
Sumesh
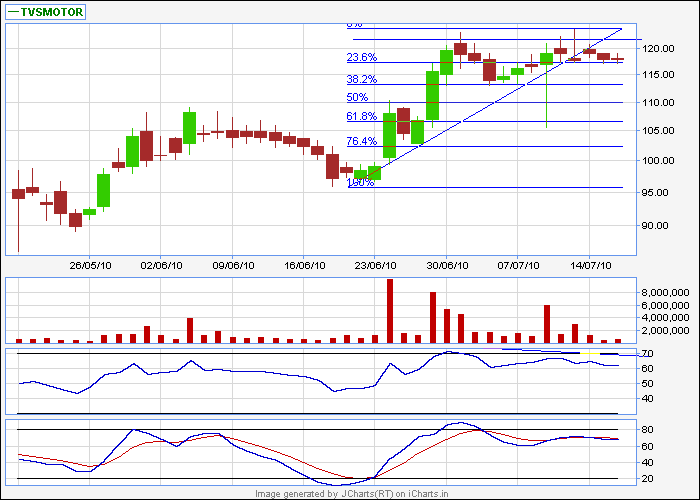
TVSMOTORS is in strong uptrend on daily/weekly/monthly charts. Indicators loose relevance in strong trends.
For every OB reading on RSI price is making a new high. Let the price come into sideways / consolidation mode then take a view.
The price points taken by you are prety far off on time scale.
On daily charts it has formed an NVK and given a sell you can expect a minor pullback. TGTs 113>106. Chart attached
SHEKHAR
| Description: |
|
| Filesize: |
10.84 KB |
| Viewed: |
2211 Time(s) |
|
|
|
| Back to top |
|
 |
girishhu1
White Belt

Joined: 17 Aug 2009
Posts: 316
|
Post: #64  Posted: Sat Jul 24, 2010 2:18 pm Post subject: Posted: Sat Jul 24, 2010 2:18 pm Post subject: |
 |
|
hi ravi,
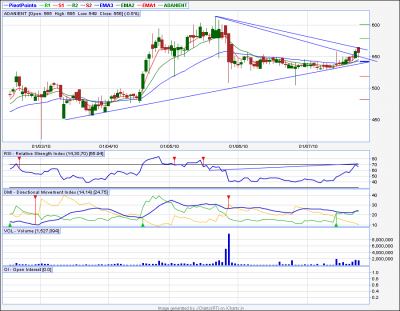
positive divergence on adani ent with increase in vol.any guess about target & sl?
| Description: |
|
| Filesize: |
48.91 KB |
| Viewed: |
405 Time(s) |
|
|
|
| Back to top |
|
 |
girishhu1
White Belt

Joined: 17 Aug 2009
Posts: 316
|
Post: #65  Posted: Sat Jul 24, 2010 2:49 pm Post subject: Posted: Sat Jul 24, 2010 2:49 pm Post subject: |
 |
|
hello shekhar, ravi,
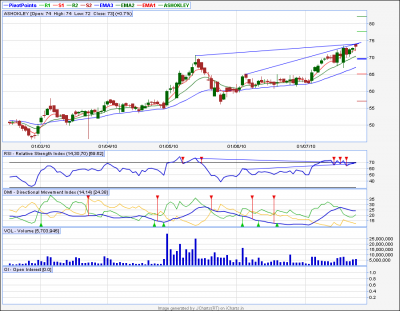
negative divergence in ashok leyland. i hope "The price points taken by you are prety far off on time scale." is not applicable here. howevwr we may have to wait until trending is over?
regards
girish
| Description: |
|
| Filesize: |
46.98 KB |
| Viewed: |
436 Time(s) |
|
|
|
| Back to top |
|
 |
girishhu1
White Belt

Joined: 17 Aug 2009
Posts: 316
|
Post: #66  Posted: Sat Jul 24, 2010 3:06 pm Post subject: Posted: Sat Jul 24, 2010 3:06 pm Post subject: |
 |
|
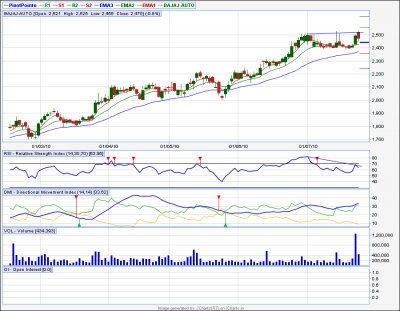
one more with clean -ve divergence. note the volume associated.
| Description: |
|
| Filesize: |
41.41 KB |
| Viewed: |
439 Time(s) |
|
|
|
| Back to top |
|
 |
shekharinvest
Yellow Belt

Joined: 21 Dec 2007
Posts: 549
|
Post: #67  Posted: Sat Jul 24, 2010 8:52 pm Post subject: Posted: Sat Jul 24, 2010 8:52 pm Post subject: |
 |
|
girishhu1,
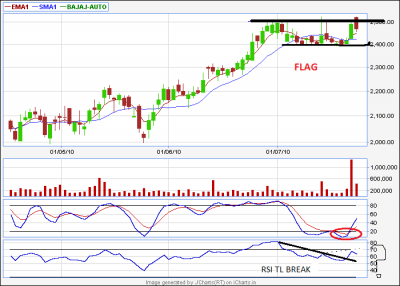
Ashok Leyland is certainly not a case of -ve divergence, as marked on the chart.
Bajaj-auto also does not gives me a feel of -ve divergence (NVK to be more precise) although it looks so on charts. For simple reason the huge volume on the previous day does not looks like a blowoff volume rather it seems to be preparing for breakout. One can buy here also with SL of 2391, or after BO.
More than the academic setup it is the feelling you get on the first view of the chart which confirms the setup. If you get that feeling no need for confirmations.
Nice attempt keep posting.
SHEKHAR
| Description: |
|
| Filesize: |
24.4 KB |
| Viewed: |
448 Time(s) |
|
|
|
| Back to top |
|
 |
sumesh_sol
Brown Belt

Joined: 06 Jun 2010
Posts: 2344
|
Post: #68  Posted: Sat Jul 24, 2010 11:41 pm Post subject: Posted: Sat Jul 24, 2010 11:41 pm Post subject: |
 |
|
Dear Shekhar Sir,
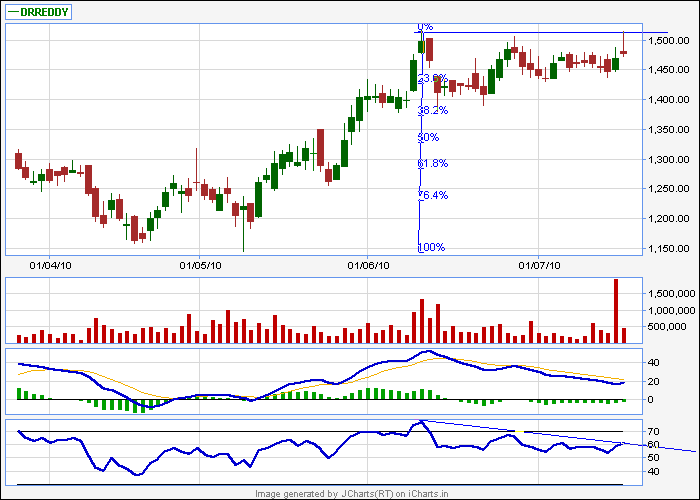
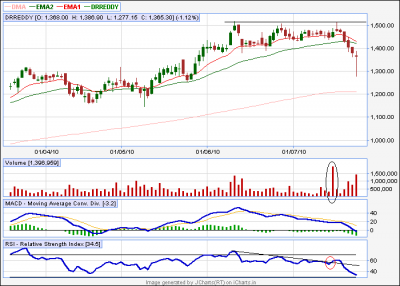
I cannot question your experience, but with my recent experience of another NVK short setup of DRREDDY, I still can say that NVK might just work in the case of Bajaj-Auto also.
Please see in the attached chart of Drreddy(Pre and Post) :
1.) There was also a high volume before it gave up.(marked)
2.) There was also a RSI TL break. (marked).
Just my view, I may be wrong also.
Regards,
Sumesh
| shekharinvest wrote: | girishhu1,
Ashok Leyland is certainly not a case of -ve divergence, as marked on the chart.
Bajaj-auto also does not gives me a feel of -ve divergence (NVK to be more precise) although it looks so on charts. For simple reason the huge volume on the previous day does not looks like a blowoff volume rather it seems to be preparing for breakout. One can buy here also with SL of 2391, or after BO.
More than the academic setup it is the feelling you get on the first view of the chart which confirms the setup. If you get that feeling no need for confirmations.
Nice attempt keep posting.
SHEKHAR |
| Description: |
|
| Filesize: |
10.65 KB |
| Viewed: |
2355 Time(s) |
|
| Description: |
|
| Filesize: |
23.61 KB |
| Viewed: |
452 Time(s) |
|
|
|
| Back to top |
|
 |
aloktewari
White Belt

Joined: 18 Aug 2009
Posts: 20
|
Post: #69  Posted: Sun Jul 25, 2010 11:33 am Post subject: Divergence Posted: Sun Jul 25, 2010 11:33 am Post subject: Divergence |
 |
|
I can see divergence in many stock futures :
Postive divergence - SCI
Negative Divergence - Ashokley, Axis bank, BRFL, DLF, Mcleodrussel, Unitech
I am not an expert in divergence so some or all of them may not be valid divergences. Can some of the experts check & advise if indeed they have divergences with possible targets etc.
Cheers !!!
Alok Tewari
|
|
| Back to top |
|
 |
rvg
White Belt

Joined: 31 Oct 2006
Posts: 279
|
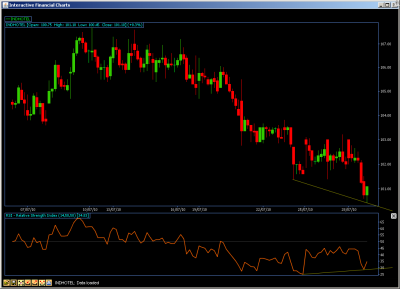
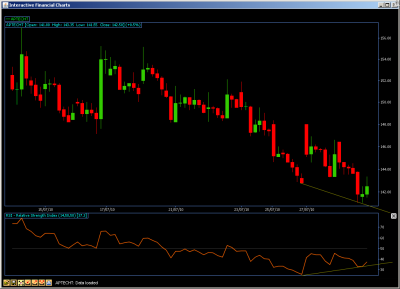
Post: #70  Posted: Wed Jul 28, 2010 4:11 pm Post subject: Aptech and Indian Hotel showing +ve Divergence Posted: Wed Jul 28, 2010 4:11 pm Post subject: Aptech and Indian Hotel showing +ve Divergence |
 |
|
+ve divergence
| Description: |
|
| Filesize: |
42.12 KB |
| Viewed: |
482 Time(s) |
|
| Description: |
|
| Filesize: |
39.93 KB |
| Viewed: |
437 Time(s) |
|
|
|
| Back to top |
|
 |
sherbaaz
Yellow Belt

Joined: 27 May 2009
Posts: 543
|
Post: #71  Posted: Wed Jul 28, 2010 4:11 pm Post subject: Posted: Wed Jul 28, 2010 4:11 pm Post subject: |
 |
|
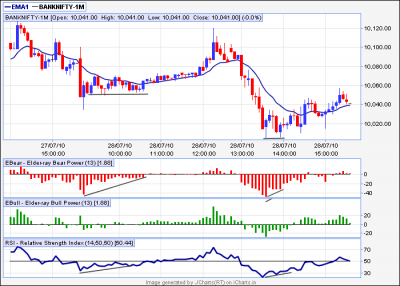
Two bullish divergences in Banknifty-1m giving 75 points intra day.
regards
| Description: |
|
| Filesize: |
19.58 KB |
| Viewed: |
505 Time(s) |
|
|
|
| Back to top |
|
 |
sherbaaz
Yellow Belt

Joined: 27 May 2009
Posts: 543
|
Post: #72  Posted: Thu Jul 29, 2010 4:08 pm Post subject: Posted: Thu Jul 29, 2010 4:08 pm Post subject: |
 |
|
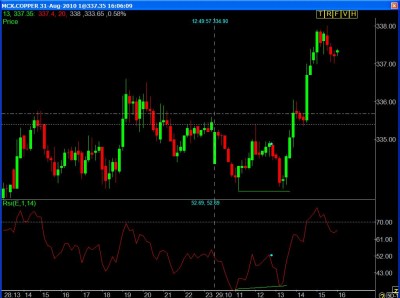
Bullish divergence in copper 10minute chart
| Description: |
|
| Filesize: |
83.62 KB |
| Viewed: |
469 Time(s) |
|
|
|
| Back to top |
|
 |
sherbaaz
Yellow Belt

Joined: 27 May 2009
Posts: 543
|
Post: #73  Posted: Thu Jul 29, 2010 5:13 pm Post subject: Posted: Thu Jul 29, 2010 5:13 pm Post subject: |
 |
|
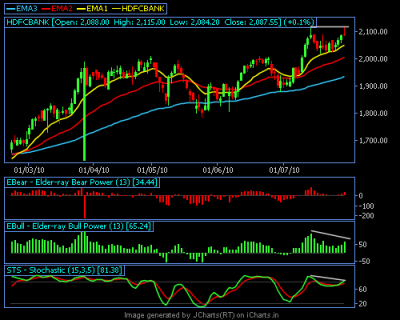
bearish divergence in HDFCBANK eod charts
| Description: |
|
| Filesize: |
15.92 KB |
| Viewed: |
507 Time(s) |
|
|
|
| Back to top |
|
 |
pradeepgolfer
White Belt

Joined: 16 Sep 2009
Posts: 212
|
Post: #74  Posted: Fri Jul 30, 2010 9:29 am Post subject: Posted: Fri Jul 30, 2010 9:29 am Post subject: |
 |
|
Sherbaz
what u have shown is not bearish divergence-it is not clear whether a higher top will be made. u have to wait before it is clear
|
|
| Back to top |
|
 |
sherbaaz
Yellow Belt

Joined: 27 May 2009
Posts: 543
|
Post: #75  Posted: Fri Jul 30, 2010 10:31 am Post subject: Posted: Fri Jul 30, 2010 10:31 am Post subject: |
 |
|
Pradip,
If you are talking about HDFCBank chart certainly its a class B bearish divergence. If you see 29th candle, its a shooting star. the bull power is not supporting the up move, which is clearly visible. Also STS is not supporting the up move in the prices.
Whether its a top of not does not make any difference to me. The stock is in strong up trend which is clearly visible on the chart.
What I am interested is to take advantage of correction in the stock by shorting it (if getting an opportunity).
May be this divergence may reverse the trend also in the stock in coming days.
reagrds,
|
|
| Back to top |
|
 |
|

