| View previous topic :: View next topic |
| Author |
Trading Divergences... |
sunrays
White Belt

Joined: 19 Dec 2009
Posts: 71
|
Post: #76  Posted: Fri Jul 30, 2010 11:21 am Post subject: Posted: Fri Jul 30, 2010 11:21 am Post subject: |
 |
|
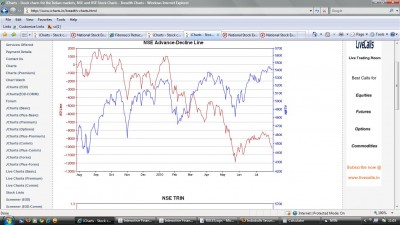
nifty is trading near the current high's but the adv-decline line is falling steeply....this to me luks like a strong negative divergence or some and henceforth a healthy correction in the nifty.....will it happen sooner or later ? is it time for people wid long delivery postion to be cautious?
| Description: |
|
| Filesize: |
151.21 KB |
| Viewed: |
470 Time(s) |
|
|
|
| Back to top |
|
 |
|
|
 |
Ravi_S
Yellow Belt

Joined: 15 Jun 2009
Posts: 569
|
|
| Back to top |
|
 |
nageswararao_v
White Belt

Joined: 22 Jul 2010
Posts: 54
|
Post: #78  Posted: Fri Oct 08, 2010 11:27 am Post subject: Re: NIFTY = DIVERGENCE Posted: Fri Oct 08, 2010 11:27 am Post subject: Re: NIFTY = DIVERGENCE |
 |
|
| Ravi_S wrote: | Look at this in Yahoo charts... Does Icharts also show similar divergence...
I've put my money.. Lets see...  |
Ravi, Can i take nifty future in small qty?
|
|
| Back to top |
|
 |
singh.ravee
Yellow Belt

Joined: 12 Aug 2010
Posts: 678
|
Post: #79  Posted: Mon Jan 24, 2011 10:10 pm Post subject: Short on TCS Posted: Mon Jan 24, 2011 10:10 pm Post subject: Short on TCS |
 |
|
Ravi_S hello,
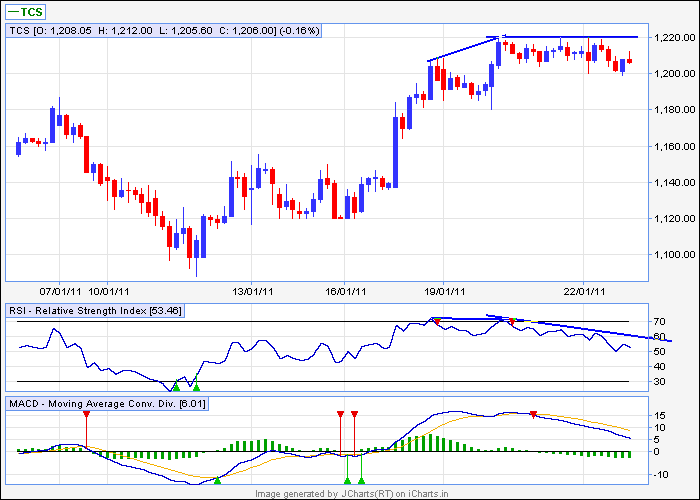
I m attaching chart of tcs on 60 min tf. I have taken entry as per first bearish divergence. I m still sitting short on tcs as per second bearish divergence signal. Sl= 1220. tgt= 1195- 1180 generated by fibo retracement as guided by you.
Kindly share your valuable observation about it.
thanks and regards
ravee
| Description: |
|
| Filesize: |
11.52 KB |
| Viewed: |
1895 Time(s) |
|
|
|
| Back to top |
|
 |
Ravi_S
Yellow Belt

Joined: 15 Jun 2009
Posts: 569
|
Post: #80  Posted: Mon Jan 24, 2011 11:09 pm Post subject: Re: Short on TCS Posted: Mon Jan 24, 2011 11:09 pm Post subject: Re: Short on TCS |
 |
|
Sing.Ravee
Since you have taken a position, nothing to worry. Keep the SL @ slightly above 1220, say 1225, so that there would be something to play with. This hass a Class A as well as Class B. TCS being not so volatile stock, would take its own time.. Adding on to this if RBI announces a 50 bps rate hike tomm, markets may take a U turn. So no worries, keep you trade and enjoy the profits.
Regards
Ravi
| singh.ravee wrote: | Ravi_S hello,
I m attaching chart of tcs on 60 min tf. I have taken entry as per first bearish divergence. I m still sitting short on tcs as per second bearish divergence signal. Sl= 1220. tgt= 1195- 1180 generated by fibo retracement as guided by you.
Kindly share your valuable observation about it.
thanks and regards
ravee |
|
|
| Back to top |
|
 |
singh.ravee
Yellow Belt

Joined: 12 Aug 2010
Posts: 678
|
Post: #81  Posted: Mon Jan 24, 2011 11:34 pm Post subject: Posted: Mon Jan 24, 2011 11:34 pm Post subject: |
 |
|
Ravi_S,
thank u so much for your observation. i feel more confident now.
Hope u remem tata motors symmetrical triangle. i m still not bearish on tata motors. i found a similar example in edward magee's book.
1160- 1200 are two ends of tata motors. around 100rupees ride is waiting on either side, since a pendant is forming in eod. lets hope for the best.
rgds
ravee
|
|
| Back to top |
|
 |
singh.ravee
Yellow Belt

Joined: 12 Aug 2010
Posts: 678
|
Post: #82  Posted: Mon Jan 31, 2011 3:18 pm Post subject: Posted: Mon Jan 31, 2011 3:18 pm Post subject: |
 |
|
Ravi_S hello,
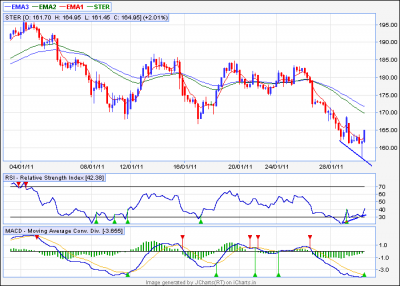
is it a bullish divergence in ster 60min. tgt= 170
rgds
ravee
| Description: |
|
| Filesize: |
16.16 KB |
| Viewed: |
432 Time(s) |
|
|
|
| Back to top |
|
 |
shekharinvest
Yellow Belt

Joined: 21 Dec 2007
Posts: 549
|
Post: #83  Posted: Mon Jan 31, 2011 3:37 pm Post subject: Posted: Mon Jan 31, 2011 3:37 pm Post subject: |
 |
|
| singh.ravee wrote: | Ravi_S hello,
is it a bullish divergence in ster 60min. tgt= 170
rgds
ravee |
Ravee,
I could not get the TF from charts but it is a very good NVK setup, if you draw the support line straight (horizontally).
One should have entered at the close of hammer (candle).
Nice Find.
SHEKHAR
|
|
| Back to top |
|
 |
Ravi_S
Yellow Belt

Joined: 15 Jun 2009
Posts: 569
|
Post: #84  Posted: Mon Jan 31, 2011 3:45 pm Post subject: Re: Short on TCS Posted: Mon Jan 31, 2011 3:45 pm Post subject: Re: Short on TCS |
 |
|
Ravee,
R u still holding on to TCS or you booked at 1180 levels?
Regards
Ravi
| singh.ravee wrote: | Ravi_S hello,
I m attaching chart of tcs on 60 min tf. I have taken entry as per first bearish divergence. I m still sitting short on tcs as per second bearish divergence signal. Sl= 1220. tgt= 1195- 1180 generated by fibo retracement as guided by you.
Kindly share your valuable observation about it.
thanks and regards
ravee |
|
|
| Back to top |
|
 |
singh.ravee
Yellow Belt

Joined: 12 Aug 2010
Posts: 678
|
Post: #85  Posted: Mon Jan 31, 2011 3:56 pm Post subject: Posted: Mon Jan 31, 2011 3:56 pm Post subject: |
 |
|
i booked at 1182.
rgds
|
|
| Back to top |
|
 |
singh.ravee
Yellow Belt

Joined: 12 Aug 2010
Posts: 678
|
Post: #86  Posted: Mon Jan 31, 2011 8:25 pm Post subject: Posted: Mon Jan 31, 2011 8:25 pm Post subject: |
 |
|
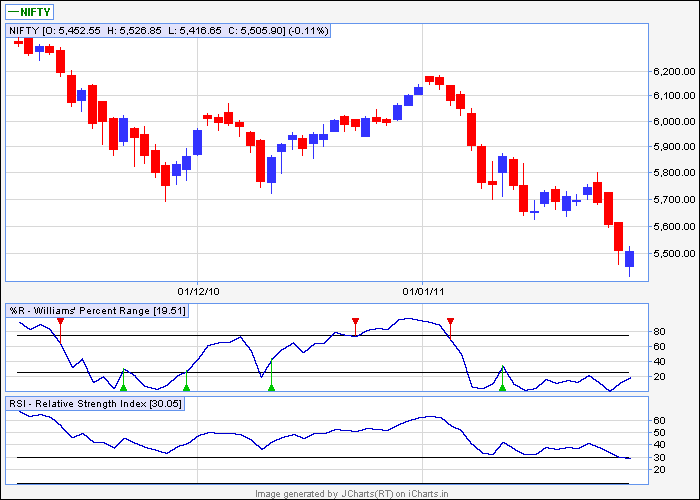
Is it a on-neck pattern in nifty, which is viewed as bearish in falling market.
rgds
ravee
| Description: |
|
| Filesize: |
9.39 KB |
| Viewed: |
1797 Time(s) |
|
|
|
| Back to top |
|
 |
amitkbaid1008
Yellow Belt

Joined: 04 Mar 2009
Posts: 540
|
Post: #87  Posted: Mon Jan 31, 2011 9:27 pm Post subject: Posted: Mon Jan 31, 2011 9:27 pm Post subject: |
 |
|
| singh.ravee wrote: | Is it a on-neck pattern in nifty, which is viewed as bearish in falling market.
rgds
ravee |
Singh Ravee
It is not on-neck pattern as NIFTY closed at 5505.90 much higher than the previous day low of 5459.55. For on neck pattern close should be around previous day's low.
It is some thing like "MEETING LINES BULLISH"
Let's hope for reversal

|
|
| Back to top |
|
 |
chetan83
Brown Belt

Joined: 19 Feb 2010
Posts: 2037
|
Post: #88  Posted: Tue Feb 01, 2011 11:16 am Post subject: NIFTY-1M AT 60 MINS Posted: Tue Feb 01, 2011 11:16 am Post subject: NIFTY-1M AT 60 MINS |
 |
|
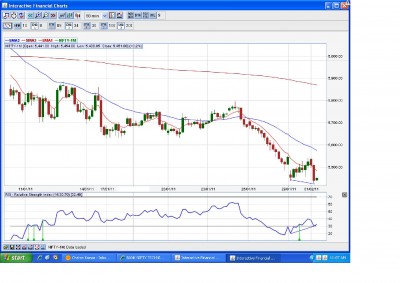
Hi All,
Pls comment on + ive Div getting formed in Nifty 60Mins.
I m long at 5442, SL - 5419, T - 5467, 5481, 5498
Regards,
Chetan.
| Description: |
|
| Filesize: |
230.67 KB |
| Viewed: |
433 Time(s) |
|
|
|
| Back to top |
|
 |
singh.ravee
Yellow Belt

Joined: 12 Aug 2010
Posts: 678
|
Post: #89  Posted: Tue Feb 01, 2011 11:18 am Post subject: Posted: Tue Feb 01, 2011 11:18 am Post subject: |
 |
|
chetan,
the last candle of the chart will complete at 12 pm.
till then we can not draw downward sloping trendline.
so its difficult to say a new low has been formed till 12pm
hope it suffice
rgsd
ravee
|
|
| Back to top |
|
 |
chetan83
Brown Belt

Joined: 19 Feb 2010
Posts: 2037
|
Post: #90  Posted: Tue Feb 01, 2011 11:43 am Post subject: Posted: Tue Feb 01, 2011 11:43 am Post subject: |
 |
|
| singh.ravee wrote: | chetan,
the last candle of the chart will complete at 12 pm.
till then we can not draw downward sloping trendline.
so its difficult to say a new low has been formed till 12pm
hope it suffice
rgsd
ravee |
Hi,
I had observed the same in 30 mins TF, so I went long at 5442 after 11am, pls correct, if this does not hold true to trade in divergence in 30mins TF.
Regards,
Chetan.
|
|
| Back to top |
|
 |
|

