| View previous topic :: View next topic |
| Author |
Trading Divergences... |
singh.ravee
Yellow Belt

Joined: 12 Aug 2010
Posts: 678
|
|
| Back to top |
|
 |
|
|
 |
singh.ravee
Yellow Belt

Joined: 12 Aug 2010
Posts: 678
|
Post: #92  Posted: Tue Feb 01, 2011 12:10 pm Post subject: Posted: Tue Feb 01, 2011 12:10 pm Post subject: |
 |
|
Ravi_S,
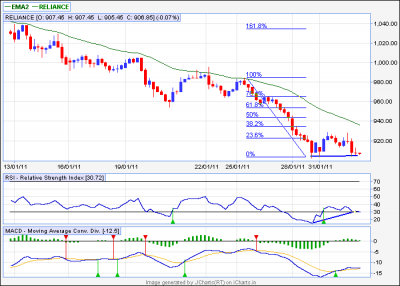
Is it a bullish divergence in reliance 60min
thanks and regards
ravee
| Description: |
|
| Filesize: |
13.05 KB |
| Viewed: |
417 Time(s) |

|
|
|
| Back to top |
|
 |
amitkbaid1008
Yellow Belt

Joined: 04 Mar 2009
Posts: 540
|
Post: #93  Posted: Tue Feb 01, 2011 12:13 pm Post subject: Posted: Tue Feb 01, 2011 12:13 pm Post subject: |
 |
|
Dear Singh Ravee & Chetan
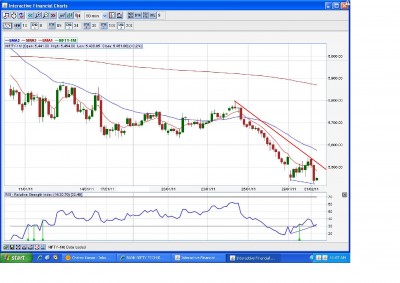
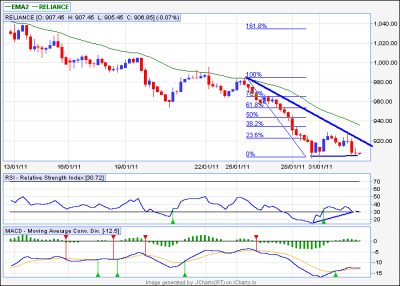
As you both pointed for +ive divergence in RELIANCE & NIFTY on hourly charts but I would say that till there is no trend line break out happens no mean taking a trade.
|
|
| Back to top |
|
 |
singh.ravee
Yellow Belt

Joined: 12 Aug 2010
Posts: 678
|
Post: #94  Posted: Tue Feb 01, 2011 12:19 pm Post subject: Posted: Tue Feb 01, 2011 12:19 pm Post subject: |
 |
|
| amitkbaid1008 wrote: | Dear Singh Ravee & Chetan
As you both pointed for +ive divergence in RELIANCE & NIFTY on hourly charts but I would say that till there is no trend line break out happens no mean taking a trade. |
amitkbaid1008 ji,
it would be nice on your part if u can post the chart with trendline drawn. I have never used trendlines and dont know how to use them. May be an illustration by you will help both of us understand better.
thanks and regards
ravee
|
|
| Back to top |
|
 |
Ravi_S
Yellow Belt

Joined: 15 Jun 2009
Posts: 569
|
Post: #95  Posted: Tue Feb 01, 2011 12:23 pm Post subject: Posted: Tue Feb 01, 2011 12:23 pm Post subject: |
 |
|
yES you can go long with SL at around 900 levels... Looks like a good NVK...
Regards
Ravi
| singh.ravee wrote: | Ravi_S,
Is it a bullish divergence in reliance 60min
thanks and regards
ravee |
|
|
| Back to top |
|
 |
amitkbaid1008
Yellow Belt

Joined: 04 Mar 2009
Posts: 540
|
Post: #96  Posted: Tue Feb 01, 2011 12:49 pm Post subject: Posted: Tue Feb 01, 2011 12:49 pm Post subject: |
 |
|
| singh.ravee wrote: | | amitkbaid1008 wrote: | Dear Singh Ravee & Chetan
As you both pointed for +ive divergence in RELIANCE & NIFTY on hourly charts but I would say that till there is no trend line break out happens no mean taking a trade. |
amitkbaid1008 ji,
it would be nice on your part if u can post the chart with trendline drawn. I have never used trendlines and dont know how to use them. May be an illustration by you will help both of us understand better.
thanks and regards
ravee |
Hi Ravee
I am posting both the charts of NIFTY & RELIANCE 60 Min TF given by you and chetan after drawing trend lines. These are just for example every one draws these trend lines in his own way.
|
|
| Back to top |
|
 |
amitkbaid1008
Yellow Belt

Joined: 04 Mar 2009
Posts: 540
|
Post: #97  Posted: Tue Feb 01, 2011 12:50 pm Post subject: Posted: Tue Feb 01, 2011 12:50 pm Post subject: |
 |
|
Here is NIFTY 60 Min TF
| Description: |
|
| Filesize: |
232.03 KB |
| Viewed: |
423 Time(s) |

|
|
|
| Back to top |
|
 |
amitkbaid1008
Yellow Belt

Joined: 04 Mar 2009
Posts: 540
|
Post: #98  Posted: Tue Feb 01, 2011 12:51 pm Post subject: Posted: Tue Feb 01, 2011 12:51 pm Post subject: |
 |
|
and here is RELIANCE chart post by you
| Description: |
|
| Filesize: |
25.31 KB |
| Viewed: |
429 Time(s) |

|
|
|
| Back to top |
|
 |
singh.ravee
Yellow Belt

Joined: 12 Aug 2010
Posts: 678
|
Post: #99  Posted: Tue Feb 01, 2011 1:01 pm Post subject: Posted: Tue Feb 01, 2011 1:01 pm Post subject: |
 |
|
amitkbaid1008 ji,
thank u so much for posting charts with trendlines.
regards
|
|
| Back to top |
|
 |
chetan83
Brown Belt

Joined: 19 Feb 2010
Posts: 2037
|
Post: #100  Posted: Tue Feb 01, 2011 1:04 pm Post subject: Posted: Tue Feb 01, 2011 1:04 pm Post subject: |
 |
|
| amitkbaid1008 wrote: | | singh.ravee wrote: | | amitkbaid1008 wrote: | Dear Singh Ravee & Chetan
As you both pointed for +ive divergence in RELIANCE & NIFTY on hourly charts but I would say that till there is no trend line break out happens no mean taking a trade. |
amitkbaid1008 ji,
it would be nice on your part if u can post the chart with trendline drawn. I have never used trendlines and dont know how to use them. May be an illustration by you will help both of us understand better.
thanks and regards
ravee |
Hi Ravee
I am posting both the charts of NIFTY & RELIANCE 60 Min TF given by you and chetan after drawing trend lines. These are just for example every one draws these trend lines in his own way. |
Hi,
No worry guys, at least I am out at 5478, bought at 5442, I was just waiting for a close abv 5462, so that at least 15 point can be achieved.
Regards,
Chetan.
|
|
| Back to top |
|
 |
singh.ravee
Yellow Belt

Joined: 12 Aug 2010
Posts: 678
|
Post: #101  Posted: Tue Feb 01, 2011 2:14 pm Post subject: Posted: Tue Feb 01, 2011 2:14 pm Post subject: |
 |
|
| singh.ravee wrote: | Is it a on-neck pattern in nifty, which is viewed as bearish in falling market.
rgds
ravee |
it turned to be bearish for the market. however missed the opportunity to trade.
|
|
| Back to top |
|
 |
chetan83
Brown Belt

Joined: 19 Feb 2010
Posts: 2037
|
Post: #102  Posted: Tue Feb 01, 2011 4:23 pm Post subject: Posted: Tue Feb 01, 2011 4:23 pm Post subject: |
 |
|
| singh.ravee wrote: | | singh.ravee wrote: | Is it a on-neck pattern in nifty, which is viewed as bearish in falling market.
rgds
ravee |
it turned to be bearish for the market. however missed the opportunity to trade. |
Hi,
Wht can be expect tomorrow, in NF, addition of another 40-60 points, or down to 5348 again (as per the trendline) or 5225 (monthly S1).
Regards,
Chetan.
|
|
| Back to top |
|
 |
Padkondu
White Belt

Joined: 23 Jan 2008
Posts: 120
|
Post: #103  Posted: Wed Feb 02, 2011 9:16 am Post subject: Trading divergence Posted: Wed Feb 02, 2011 9:16 am Post subject: Trading divergence |
 |
|
Hi frinds,
i am one of those who look in to forum to lean new things. i have always been a good learner. i would like make some suggestions to those who are posting some thing relavent to divergence.
please post the timeframe along with that chart example in the file comments column and any other vital information in that column itself.
further please mention the parameters of rsi along with the timeframe and reason for choosing such parameter.
this would help the leaners in a better way. those who are already familier with these thigs know by a glance at the chart. but if one really want to help the beginners, give as much information as required.
I post this because very often we get question in several threads regarding which timeframe, what parameters of indicators used ect., which can be avoided by giving full information along with chart example.
i thank one all posting ing this thread.
regards
padkondu
|
|
| Back to top |
|
 |
singh.ravee
Yellow Belt

Joined: 12 Aug 2010
Posts: 678
|
Post: #104  Posted: Wed Feb 02, 2011 10:12 am Post subject: Posted: Wed Feb 02, 2011 10:12 am Post subject: |
 |
|
Ravi gm,
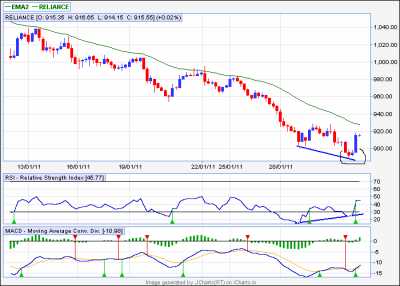
i m attaching 60min reliance chart.
there is a morning star as well as bullish divergence.
can we go long.
your valuable comments please.
regards
ravee
| Description: |
|
| Filesize: |
24 KB |
| Viewed: |
448 Time(s) |

|
|
|
| Back to top |
|
 |
Ravi_S
Yellow Belt

Joined: 15 Jun 2009
Posts: 569
|
Post: #105  Posted: Wed Feb 02, 2011 10:43 am Post subject: Posted: Wed Feb 02, 2011 10:43 am Post subject: |
 |
|
Singh.ravee, i noticed the divergence yesterday and entered at 900, today came out at 921.5... As I said I'm not good in candlesticks... 
| singh.ravee wrote: | Ravi gm,
i m attaching 60min reliance chart.
there is a morning star as well as bullish divergence.
can we go long.
your valuable comments please.
regards
ravee |
|
|
| Back to top |
|
 |
|

