| View previous topic :: View next topic |
| Author |
Trading Divergences... |
Ravi_S
Yellow Belt

Joined: 15 Jun 2009
Posts: 569
|
Post: #1  Posted: Thu Dec 17, 2009 10:10 pm Post subject: Trading Divergences... Posted: Thu Dec 17, 2009 10:10 pm Post subject: Trading Divergences... |
 |
|
Hi all,
I was having a chat with Anand some time back about the divergence between price and RSI. I'll share with you the jist of our discussion as I saw this was the right thread to post this. Following extract is taken from Elder Alexanders Book "Trading for a Living". This was posted in the NVK Setup thread. As per Junta's view putting it in a new post so that charts could be added later on this thread.
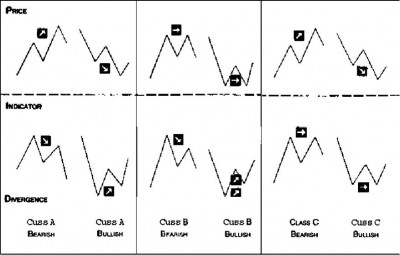
"There are 3 classes of Bullish and Bearish Divergences.
Class A Bullish Divergence:
Class A Bullish Divergences occur only when prices makes a lower low but the oscillator makes a higher low. This is the strongest buy signal.
Class A Bearish Divergence:
Class A Bearish Divergences occur only when the prices make a higher high but the oscillator makes a lower high. This is the strongest sell signal.
Class B Bullish Divergence:
Class B Bullish Divergences occur when price makes a double bottom and the oscillator makes a higher low. This is what we trade here in this topic (NVK Setup). This is the second strongest buy signal.
Class B Bearish Divergence:
Class B Bearish Divergences occur when price makes a double top and the oscillator makes a lower high. This is what we trade here in this topic (NVK Setup). This is the second strongest sell signal.
Class C Bullish Divergence:
Class C Bullish Divergences occur when the indicator has made a double bottom and the price makes a lower low.
Class C Bearish Divergence:
Class C Bearish Divergences occur when the indicator has made a double top and the price makes a higher high.
Of all these Class A divergences are supposedly strong and identify crutial market turning points... Class B divergences are less strong and Class C are least important. Last if you need a ruler to tell whether there is a divergence assume there is none.
The attachment should make the statements clearer.
I would try to post some charts to support these views.
Regards
Ravi
| Description: |
|
| Filesize: |
47.66 KB |
| Viewed: |
1197 Time(s) |
|
|
|
| Back to top |
|
 |
|
|
 |
sherbaaz
Yellow Belt

Joined: 27 May 2009
Posts: 543
|
Post: #2  Posted: Thu Dec 17, 2009 10:27 pm Post subject: Re: Trading Divergences... Posted: Thu Dec 17, 2009 10:27 pm Post subject: Re: Trading Divergences... |
 |
|
Hi Ravi,
Great start. Hope you keep posting new things in this thread on regular basis.
Keep rocking!
Sherbaaz
| Ravi_S wrote: | Hi all,
I was having a chat with Anand some time back about the divergence between price and RSI. I'll share with you the jist of our discussion as I saw this was the right thread to post this. Following extract is taken from Elder Alexanders Book "Trading for a Living". This was posted in the NVK Setup thread. As per Junta's view putting it in a new post so that charts could be added later on this thread.
"There are 3 classes of Bullish and Bearish Divergences.
Class A Bullish Divergence:
Class A Bullish Divergences occur only when prices makes a lower low but the oscillator makes a higher low. This is the strongest buy signal.
Class A Bearish Divergence:
Class A Bearish Divergences occur only when the prices make a higher high but the oscillator makes a lower high. This is the strongest sell signal.
Class B Bullish Divergence:
Class B Bullish Divergences occur when price makes a double bottom and the oscillator makes a higher low. This is what we trade here in this topic (NVK Setup). This is the second strongest buy signal.
Class B Bearish Divergence:
Class B Bearish Divergences occur when price makes a double top and the oscillator makes a lower high. This is what we trade here in this topic (NVK Setup). This is the second strongest sell signal.
Class C Bullish Divergence:
Class C Bullish Divergences occur when the indicator has made a double bottom and the price makes a lower low.
Class C Bearish Divergence:
Class C Bearish Divergences occur when the indicator has made a double top and the price makes a higher high.
Of all these Class A divergences are supposedly strong and identify crutial market turning points... Class B divergences are less strong and Class C are least important. Last if you need a ruler to tell whether there is a divergence assume there is none.
The attachment should make the statements clearer.
I would try to post some charts to support these views.
Regards
Ravi |
|
|
| Back to top |
|
 |
Ravi_S
Yellow Belt

Joined: 15 Jun 2009
Posts: 569
|
Post: #3  Posted: Fri Dec 18, 2009 9:04 am Post subject: Posted: Fri Dec 18, 2009 9:04 am Post subject: |
 |
|
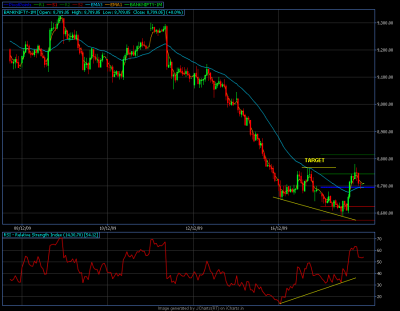
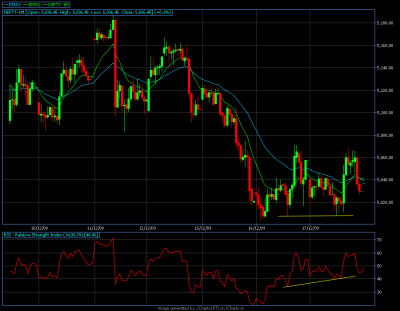
Thx Baaz.... I would try to post some charts on a daily basis to support the views... Yesterday I spotted a classic CLASS A Bullish divergence in Bank NIFTY Futures, and a class B Bullish Divergence in Nifty Futures which worked out pretty well.
I've attached the charts for you guys to check out...
| Description: |
| Classic Class A Bullish Divergence formed between Price and RSI |
|
| Filesize: |
34.43 KB |
| Viewed: |
1182 Time(s) |
|
| Description: |
| Class B divergence formed between Price and RSI |
|
| Filesize: |
35 KB |
| Viewed: |
972 Time(s) |
|
|
|
| Back to top |
|
 |
n.sreenivasan
White Belt

Joined: 04 Dec 2009
Posts: 2
|
Post: #4  Posted: Fri Dec 18, 2009 9:06 pm Post subject: appreciation Posted: Fri Dec 18, 2009 9:06 pm Post subject: appreciation |
 |
|
| excellant work MR.Ravi-s
|
|
| Back to top |
|
 |
Ravi_S
Yellow Belt

Joined: 15 Jun 2009
Posts: 569
|
Post: #5  Posted: Fri Dec 18, 2009 9:33 pm Post subject: Posted: Fri Dec 18, 2009 9:33 pm Post subject: |
 |
|
Thanks Sreeni...  I would request all the members to post weekly/daily/intraday charts either Index or Scrip in this thread which has a divergence... Discussions would be more fruitful in this manner... I've just laid the foundation and the iChartians need to build the building... I would request all the members to post weekly/daily/intraday charts either Index or Scrip in this thread which has a divergence... Discussions would be more fruitful in this manner... I've just laid the foundation and the iChartians need to build the building... 
|
|
| Back to top |
|
 |
Ravi_S
Yellow Belt

Joined: 15 Jun 2009
Posts: 569
|
Post: #6  Posted: Sat Dec 19, 2009 10:26 am Post subject: Posted: Sat Dec 19, 2009 10:26 am Post subject: |
 |
|
Pradeep, u always seem to reply in a sarcastic manner to all the threads... Anyways thanks for posting the link... Everyone knows that Internet is a good medium to learn things... Here we newbies are trying to take out some charts and do some study within ourselves... This thread may not be applicable to 15 years experienced people like you... I also can bet you that more than 50 % of the people here don't know what divergences are... If I've hurt you I'm sorry...
Regards
Ravi
|
|
| Back to top |
|
 |
sherbaaz
Yellow Belt

Joined: 27 May 2009
Posts: 543
|
Post: #7  Posted: Sat Dec 19, 2009 2:58 pm Post subject: Posted: Sat Dec 19, 2009 2:58 pm Post subject: |
 |
|
Ravi,
Donet be sorry and dont worry for guys like Pradeep with so called 15 years of exp  . Wonder wht exp such guys are having. . Wonder wht exp such guys are having.
You are doing great job keep it up i am eagarely waiting for your next post
keep rocking !
| Ravi_S wrote: | Pradeep, u always seem to reply in a sarcastic manner to all the threads... Anyways thanks for posting the link... Everyone knows that Internet is a good medium to learn things... Here we newbies are trying to take out some charts and do some study within ourselves... This thread may not be applicable to 15 years experienced people like you... I also can bet you thathere don't know what diverge
nces are... If I've hurt you I'm sorry...
Regards
Ravi |
|
|
| Back to top |
|
 |
ConMan
White Belt

Joined: 06 Aug 2008
Posts: 344
|
Post: #8  Posted: Sat Dec 19, 2009 3:45 pm Post subject: Posted: Sat Dec 19, 2009 3:45 pm Post subject: |
 |
|
Mr.Golfer
Either you think you know everything or you think we no nothing.....
If you feel there is no need for you to learn from forum why do you goto each and every thread read each and every line and then post a sarcastic message. Ravi is not trying to impress people, he is trying to explain what he has learnt and trying to improve it by constant learning from other resources.
You seem to understand nothing.
Friend I know a good doctor who treats person like you. Please contact if necessary. 
|
|
| Back to top |
|
 |
ProTrader
Site Admin

Joined: 06 Jul 2008
Posts: 433
|
Post: #9  Posted: Sun Dec 20, 2009 3:42 am Post subject: Posted: Sun Dec 20, 2009 3:42 am Post subject: |
 |
|
Dear PradeepGolfer,
It's a basic courtsey not to putt in I mean butt in when other are having a conversation. If you have something to share positively then please do it, if not then keep yourself out of the converstaion. Your posts are totally unrelevant to the conversation folks are having here. So we will be deleting them. Sorry if it hurts, but some see the hole from a 1000 yards and some see it by digging into it. They are not trying to reinvent things nor trying to create a competion to the internet.
You may not find this forum useful, they do. That's the only difference.
So we sincerely hope that you would not disrupt any conversations in the future.
Regards,
ProTrader
|
|
| Back to top |
|
 |
Ravi_S
Yellow Belt

Joined: 15 Jun 2009
Posts: 569
|
Post: #10  Posted: Mon Dec 28, 2009 10:29 pm Post subject: Posted: Mon Dec 28, 2009 10:29 pm Post subject: |
 |
|
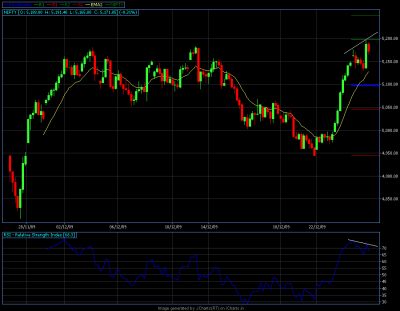
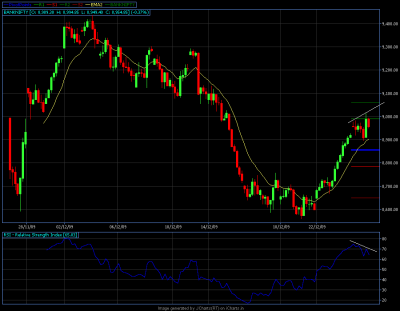
Noticed a bearish divergence in bank nifty and nifty... Lets wait and see if it works.... 
| Description: |
|
| Filesize: |
17.84 KB |
| Viewed: |
898 Time(s) |
|
| Description: |
|
| Filesize: |
17.83 KB |
| Viewed: |
752 Time(s) |
|
|
|
| Back to top |
|
 |
sherbaaz
Yellow Belt

Joined: 27 May 2009
Posts: 543
|
Post: #11  Posted: Sat Feb 27, 2010 9:55 am Post subject: Posted: Sat Feb 27, 2010 9:55 am Post subject: |
 |
|
Hi,
Ravi where have you gone no addition to such a wonderful thread. So many bullish divergences have formed in last 10 days.
Do add your inputs i am eagerly waiting rather most of the members.
regds
|
|
| Back to top |
|
 |
Ravi_S
Yellow Belt

Joined: 15 Jun 2009
Posts: 569
|
Post: #12  Posted: Sat Feb 27, 2010 6:48 pm Post subject: Posted: Sat Feb 27, 2010 6:48 pm Post subject: |
 |
|
Hi Baaz
Kind of tied up with my work these days. So very little time to do Trades. Neways, I'll see if something could be added to this.
Regards
Ravi
|
|
| Back to top |
|
 |
dgvikram
White Belt

Joined: 14 May 2009
Posts: 5
|
Post: #13  Posted: Wed Mar 03, 2010 2:31 pm Post subject: Divergence Posted: Wed Mar 03, 2010 2:31 pm Post subject: Divergence |
 |
|
Ravi,
Dont know much technical, just one question. while looking for divergences should we consider closing price of a candle or the H/Ls?
|
|
| Back to top |
|
 |
rrsekhar
White Belt

Joined: 21 Feb 2010
Posts: 196
|
Post: #14  Posted: Thu Mar 04, 2010 4:59 pm Post subject: trading divergences Posted: Thu Mar 04, 2010 4:59 pm Post subject: trading divergences |
 |
|
dear ravi, today was classic example of the three classes of divergences. i don't know how to post the charts - maybe my system knowledge requires some effort- anyway-
Class A bullish in DLF 5 min chart- price made a lower low but RSI a higher low.
Class B in NF
Class C in DLF - indicator made tripe bottom and the price a lower low.
will try posting the charts later today.
wish i had gone through this thread earlier - i would have been certainly richer.
|
|
| Back to top |
|
 |
dgvikram
White Belt

Joined: 14 May 2009
Posts: 5
|
Post: #15  Posted: Thu Mar 04, 2010 5:21 pm Post subject: CHART Posted: Thu Mar 04, 2010 5:21 pm Post subject: CHART |
 |
|
sekhar,
There is an option in icharts "Export Chart as PNG". Click and save it and then use "Add attachment" to attach the png file.
Waiting for your charts
Bikram
|
|
| Back to top |
|
 |
|

