| View previous topic :: View next topic |
| Author |
trading education for the newbees -- experts pl help |
casper
Green Belt

Joined: 02 Oct 2010
Posts: 1315
|
Post: #16  Posted: Sat Dec 18, 2010 11:22 pm Post subject: Posted: Sat Dec 18, 2010 11:22 pm Post subject: |
 |
|
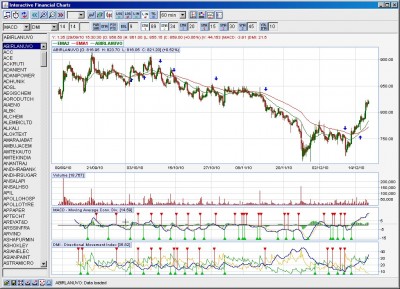
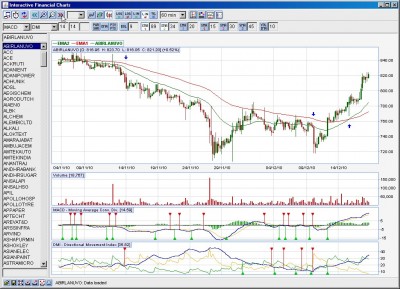
brother, i am posting a few charts with 34/89 ema cross over method which can be used for swing trades, these are back tested charts. plz go through them to understand it and if u have any question then plz do not hesitate
our idea is to go with an ema crossover viz 34/89 ema cross over, and validate that with corresponding macd and dmi
we will go long when 34 crosses above 89 or stays above 89 with macd and dmi in buy mode and we will sell when 34 is below 89 or just crossed blow 89 with macd and dmi in sell mode
our model stock in ABIRLANUVO, and we are only using 60 min real time chart
to display properly, i have broken the chart in to 4 sub units. we will start to view the chart from chart 2 to chart 5 and will match the commentary,while the chart 1 contain the total chart
all buy signals are represented by up arrow and sell signal are represented by down arrow,our primary sl will be +- 5 rupees from 89 ema depending our buy or sell trade and once in, we will trail our sl aggressively
1. our 1st trade is on 1/10/10 seeing the 34 crossing above 89 and macd/dmi in buy mode, let us trail it and we got our sl hit on the same day, but still with some profit as we were trialling our sl
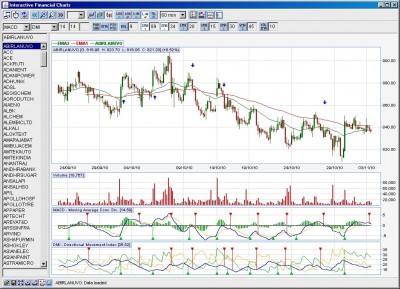
2.2nd buy is on 6/10/10, reason same, we got hit on 7th
3.next entry is sell, its on 12/10, reason? 34 below 89 and macd/dmi in sell mode, our sl got hit on 13th
4.4th entry is on 14th/10, the ema cross over is still valid,we are selling with a sell mode from macd/dmi and with a rejection from the ema, we will agin trail our stops and if we get tsl hit, then can agian short with a macd/dmi sll and a rejection of price from ema
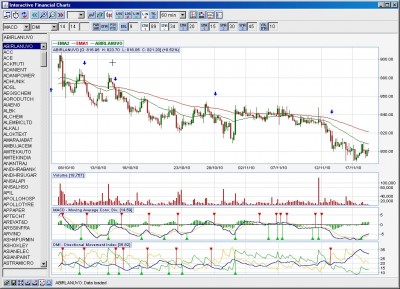
5.our 5th entry comes under the same rules also, then comes a choppy trend which in not tradable by ema cross over method as this method is only for trending phase
6.6th entry is on 12/11, trail the stop
7.9/12 is our 7th entry
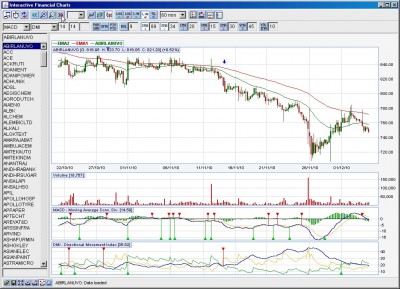
8.our 8th entry is a buy, as 34 crossed above 89 and macd/dmi is in buy mode. we will trail it and once our sl is hit,we will use every bounce form the ema with favorable macd/dmi signal to buy it again
now i think the idea is clear to u? if u want to trade like this then start back testing using this method and calculate the rsik reward ratio carefully and after proper testing including paper trade, u can give this method a try
| Description: |
|
| Filesize: |
222.77 KB |
| Viewed: |
640 Time(s) |
|
| Description: |
|
| Filesize: |
216.81 KB |
| Viewed: |
596 Time(s) |
|
| Description: |
|
| Filesize: |
210.88 KB |
| Viewed: |
576 Time(s) |
|
| Description: |
|
| Filesize: |
203.66 KB |
| Viewed: |
545 Time(s) |
|
| Description: |
|
| Filesize: |
204.88 KB |
| Viewed: |
575 Time(s) |
|
|
|
| Back to top |
|
 |
|
|
|
seshareddy
White Belt

Joined: 06 Jan 2009
Posts: 95
|
| Post: #17 Posted: Sun Dec 19, 2010 8:09 am Post subject: |
|
|
good thread i too try to give answers if i know for any required help
max i can give answers for general levels basic problems
discipline is must before starting the trading this is my personal feel
best of luck to all new guys and try to use this thread as max as possible
seshareddy
|
|
| Back to top |
|
|
singh.ravee
Yellow Belt

Joined: 12 Aug 2010
Posts: 678
|
| Post: #18 Posted: Sun Dec 19, 2010 1:10 pm Post subject: |
|
|
Hello Casper,
Kindly share how to use dmi indicator in trading. what are the parameter of dmi.
I feel it will benefit me and all those, who know nothing about this tool
thanks and regards
ravee
|
|
| Back to top |
|
|
casper
Green Belt
Joined: 02 Oct 2010
Posts: 1315
|
| Post: #19 Posted: Sun Dec 19, 2010 2:00 pm Post subject: |
|
|
| singh.ravee wrote: | Hello Casper,
Kindly share how to use dmi indicator in trading. what are the parameter of dmi.
I feel it will benefit me and all those, who know nothing about this tool
thanks and regards
ravee |
DMI and ADX is almost same.in jchart we dont have adx option, we have dmi only so i used dmi to asses the strength of the trend
infact. adx is the moving average of dmi,
so the rules of using adx is totally applicable for dmi, u can find one such set of rules posted by phadkondu in this thread also. go through it and if u need any more information plz let me know
|
|
| Back to top |
|
|
Ravi_S
Yellow Belt
Joined: 15 Jun 2009
Posts: 569
|
| Post: #20 Posted: Sun Dec 19, 2010 2:21 pm Post subject: |
|
|
Posted in the wrong thread...
Regards
Ravi
Last edited by Ravi_S on Sun Dec 19, 2010 10:26 pm; edited 1 time in total |
|
| Back to top |
|
|
seshareddy
White Belt
Joined: 06 Jan 2009
Posts: 95
|
| Post: #21 Posted: Sun Dec 19, 2010 4:43 pm Post subject: |
|
|
hi all
think about flag patterns
any move starts from flag patteren breakout
i given few from intra 30min tf 200days
flag pattern tgt is flag stick length
more time frame more strong
best of luck to ALL
seshareddy
| Description: |
|
| Filesize: |
19.44 KB |
| Viewed: |
555 Time(s) |
|
|
|
| Back to top |
|
|
seshareddy
White Belt
Joined: 06 Jan 2009
Posts: 95
|
| Post: #22 Posted: Sun Dec 19, 2010 5:29 pm Post subject: |
|
|
this is latest flag
seshareddy
| Description: |
|
| Filesize: |
16.03 KB |
| Viewed: |
593 Time(s) |
|
|
|
| Back to top |
|
|
casper
Green Belt
Joined: 02 Oct 2010
Posts: 1315
|
| Post: #23 Posted: Sun Dec 19, 2010 7:03 pm Post subject: |
|
|
nice pattern sesha sir. and one thing which is making me more happy that u started drawing simple trend lines in the morning post and then step by step with trial and error u finally reached to the flag
i salute ur enthusiasm, the way u reached to the flag is really remarkable. and i am sure now u r really satisfied with the out come and will happily trade it to bring out positive result

|
|
| Back to top |
|
|
seshareddy
White Belt
Joined: 06 Jan 2009
Posts: 95
|
| Post: #24 Posted: Sun Dec 19, 2010 7:21 pm Post subject: |
|
|
hi casper
seshareddy 
|
|
| Back to top |
|
|
Padkondu
White Belt
Joined: 23 Jan 2008
Posts: 120
|
| Post: #25 Posted: Sun Dec 19, 2010 7:33 pm Post subject: thankQ Casper |
|
|
dear casper,
thanks for ur suggestion and the system u posted here. i will try this out on papaer this week and let u know.
regards
padkondu
|
|
| Back to top |
|
|
Padkondu
White Belt
Joined: 23 Jan 2008
Posts: 120
|
| Post: #26 Posted: Sun Dec 19, 2010 7:40 pm Post subject: seshareddy garu thanks for your involvement. |
|
|
Sesha sir
thanks for your involvement. ever since i started this thread, there has been a good responce from the experts. but the only agony is that no novice is asking questions here, except me.
regards
padkondu

| seshareddy wrote: | good thread i too try to give answers if i know for any required help
max i can give answers for general levels basic problems
discipline is must before starting the trading this is my personal feel
best of luck to all new guys and try to use this thread as max as possible
seshareddy |
|
|
| Back to top |
|
|
Padkondu
White Belt
Joined: 23 Jan 2008
Posts: 120
|
| Post: #27 Posted: Sun Dec 19, 2010 7:56 pm Post subject: |
|
|
Hi singh.ravee
DMI/ADX indicator is available in i charts as DMI indicator. please go through the older posts in this thread. there is a doc file which u can down load. it explains how to interpret the dmi indicator. it is basically meant to find whether the market is trending or rangebound and the strenght of trend if trending. it is used in most of the trend following strategies for this purpose only. only problem with it is that it is a much lagging indicator. other interpretations i do not know.
regards
padkondu
| singh.ravee wrote: | Hello Casper,
Kindly share how to use dmi indicator in trading. what are the parameter of dmi.
I feel it will benefit me and all those, who know nothing about this tool
thanks and regards
ravee |
|
|
| Back to top |
|
|
Padkondu
White Belt
Joined: 23 Jan 2008
Posts: 120
|
| Post: #28 Posted: Mon Dec 20, 2010 5:27 am Post subject: |
|
|
Ravi Sir,
What went wrong?.............
Padkondu
| Ravi_S wrote: | Posted in the wrong thread...
Regards
Ravi |
|
|
| Back to top |
|
|
Ravi_S
Yellow Belt
Joined: 15 Jun 2009
Posts: 569
|
| Post: #29 Posted: Mon Dec 20, 2010 9:42 am Post subject: |
|
|
Wrong calculations so reverted back the post... 
| Padkondu wrote: | Ravi Sir,
What went wrong?.............
Padkondu
| Ravi_S wrote: | Posted in the wrong thread...
Regards
Ravi |
|
|
|
| Back to top |
|
|
sherbaaz
Yellow Belt
Joined: 27 May 2009
Posts: 543
|
| Post: #30 Posted: Mon Dec 20, 2010 10:16 am Post subject: Re: seshareddy garu thanks for your involvement. |
|
|
[quote="Padkondu"]Sesha sir
thanks for your involvement. ever since i started this thread, there has been a good responce from the experts. but the only agony is that no novice is asking questions here, except me.
regards
padkondu
Rest all are experts. 
Regards
|
|
| Back to top |
|
|
|


